Dashboard design examples
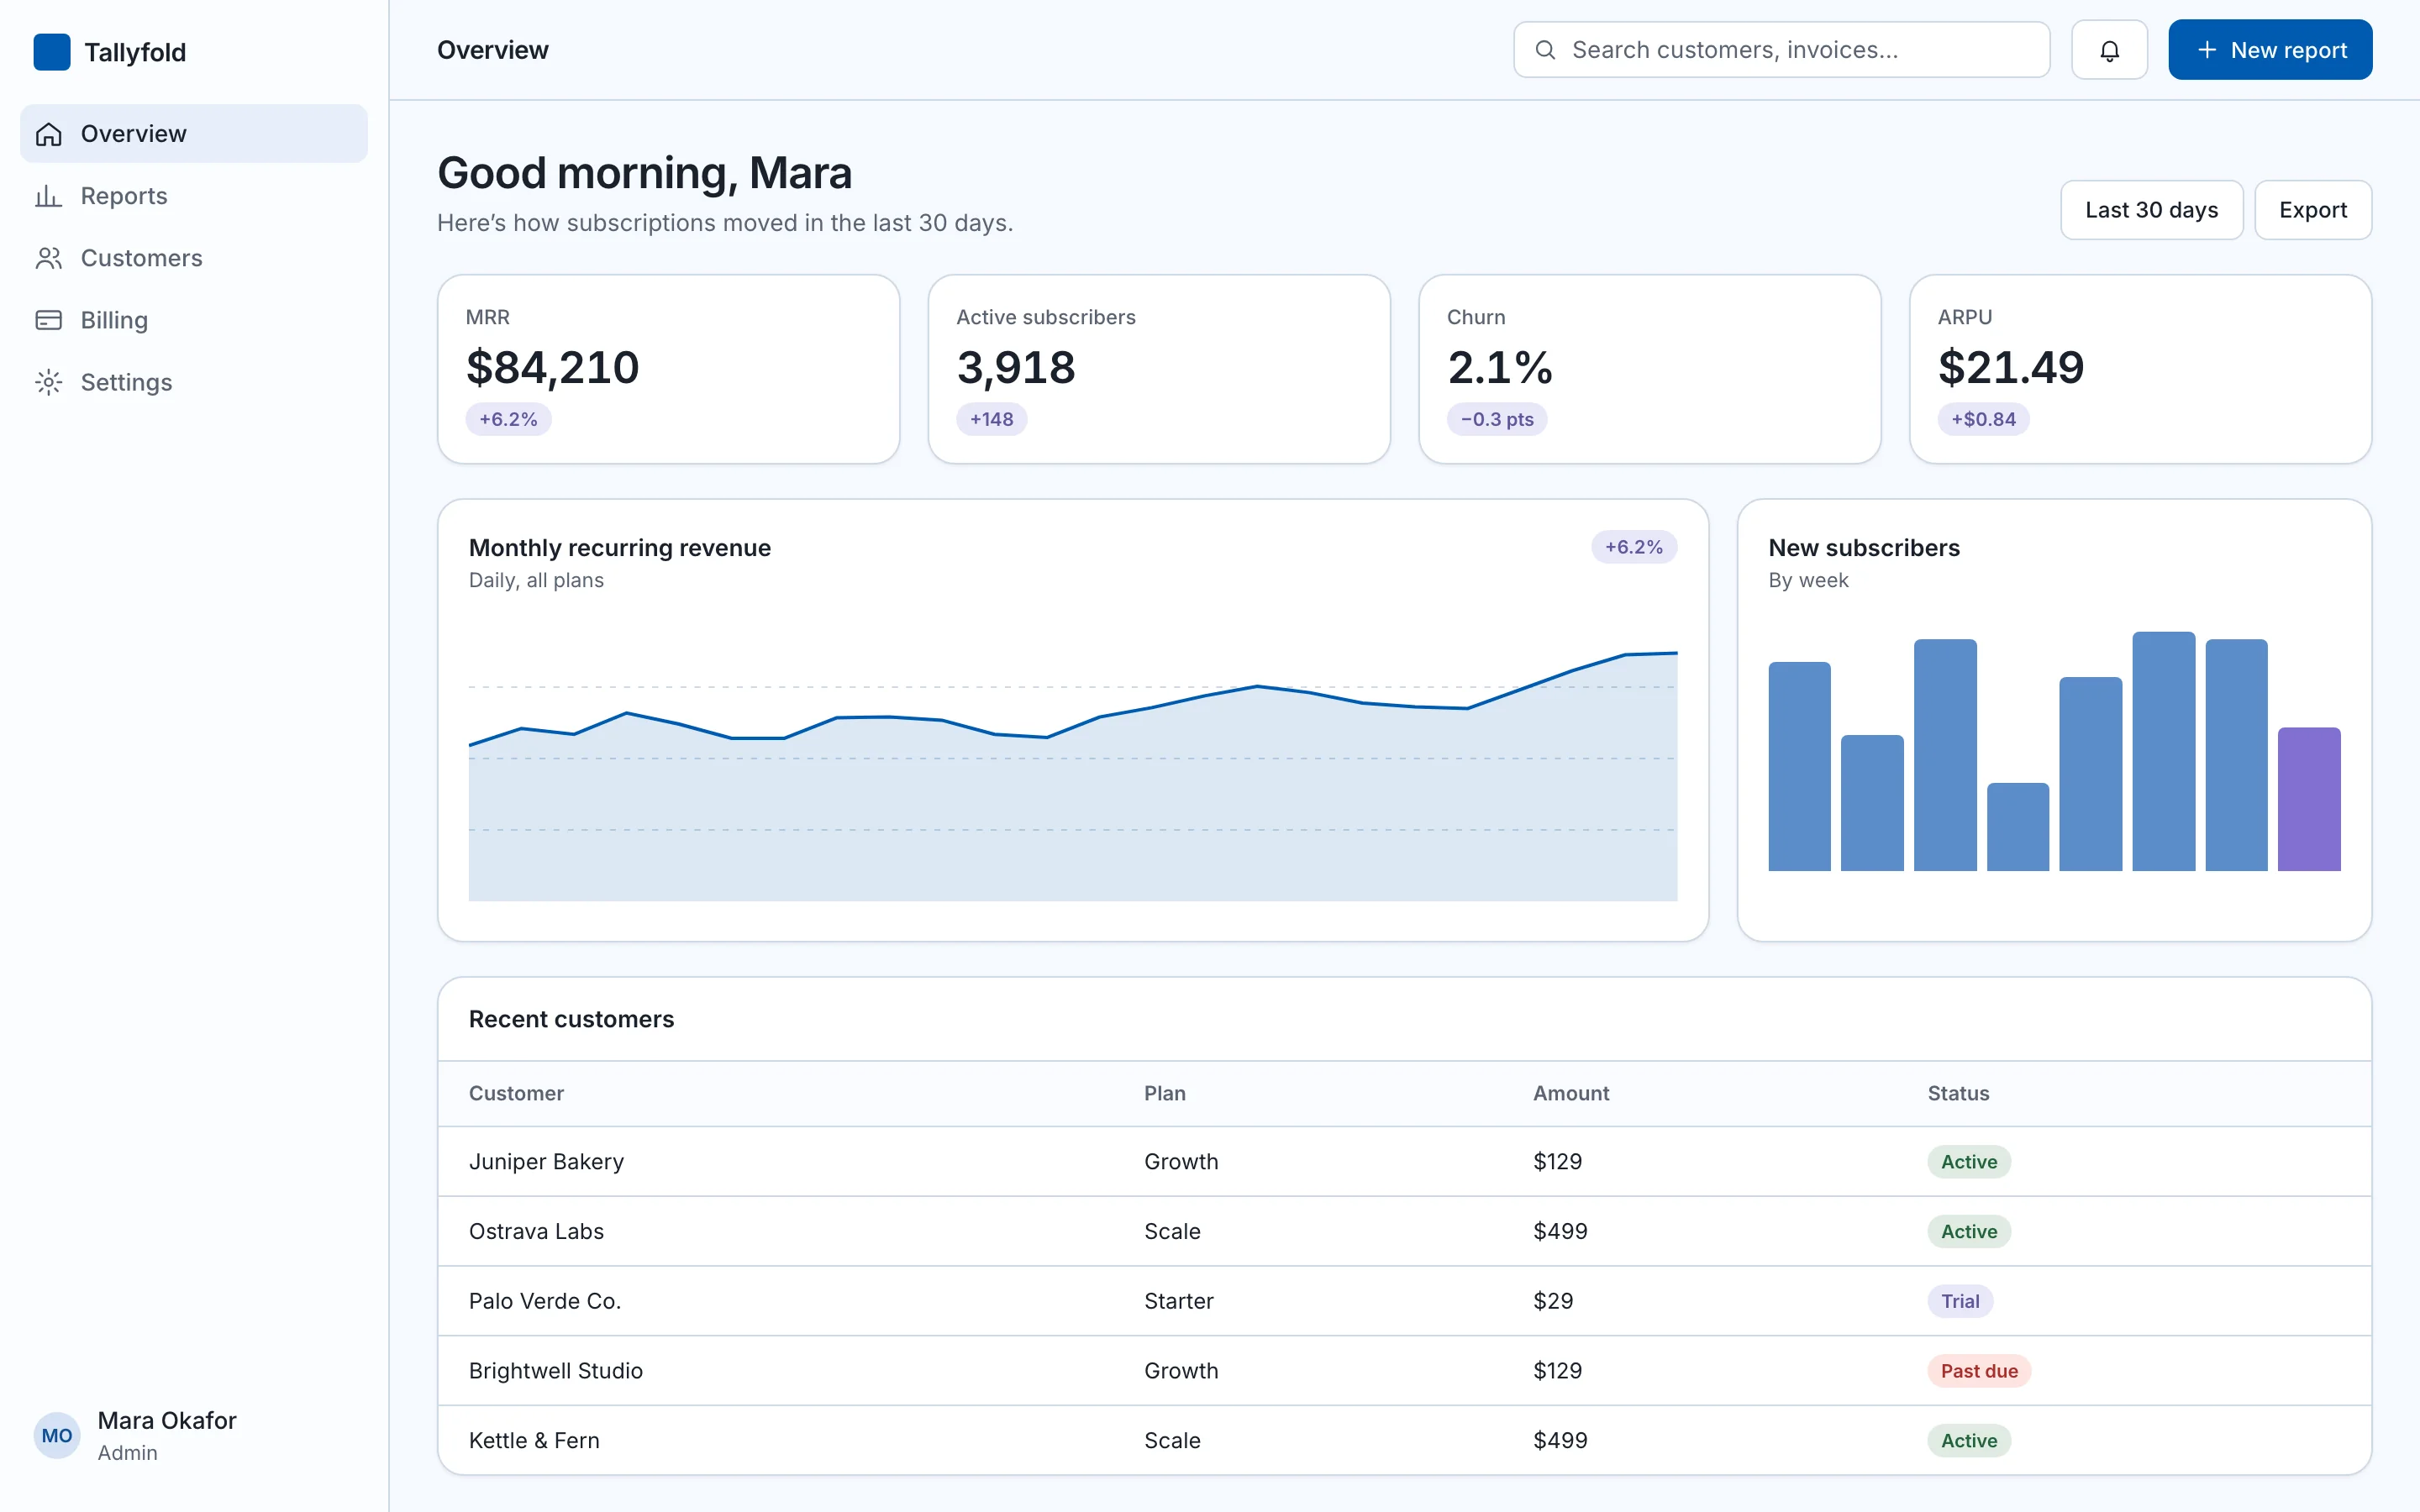
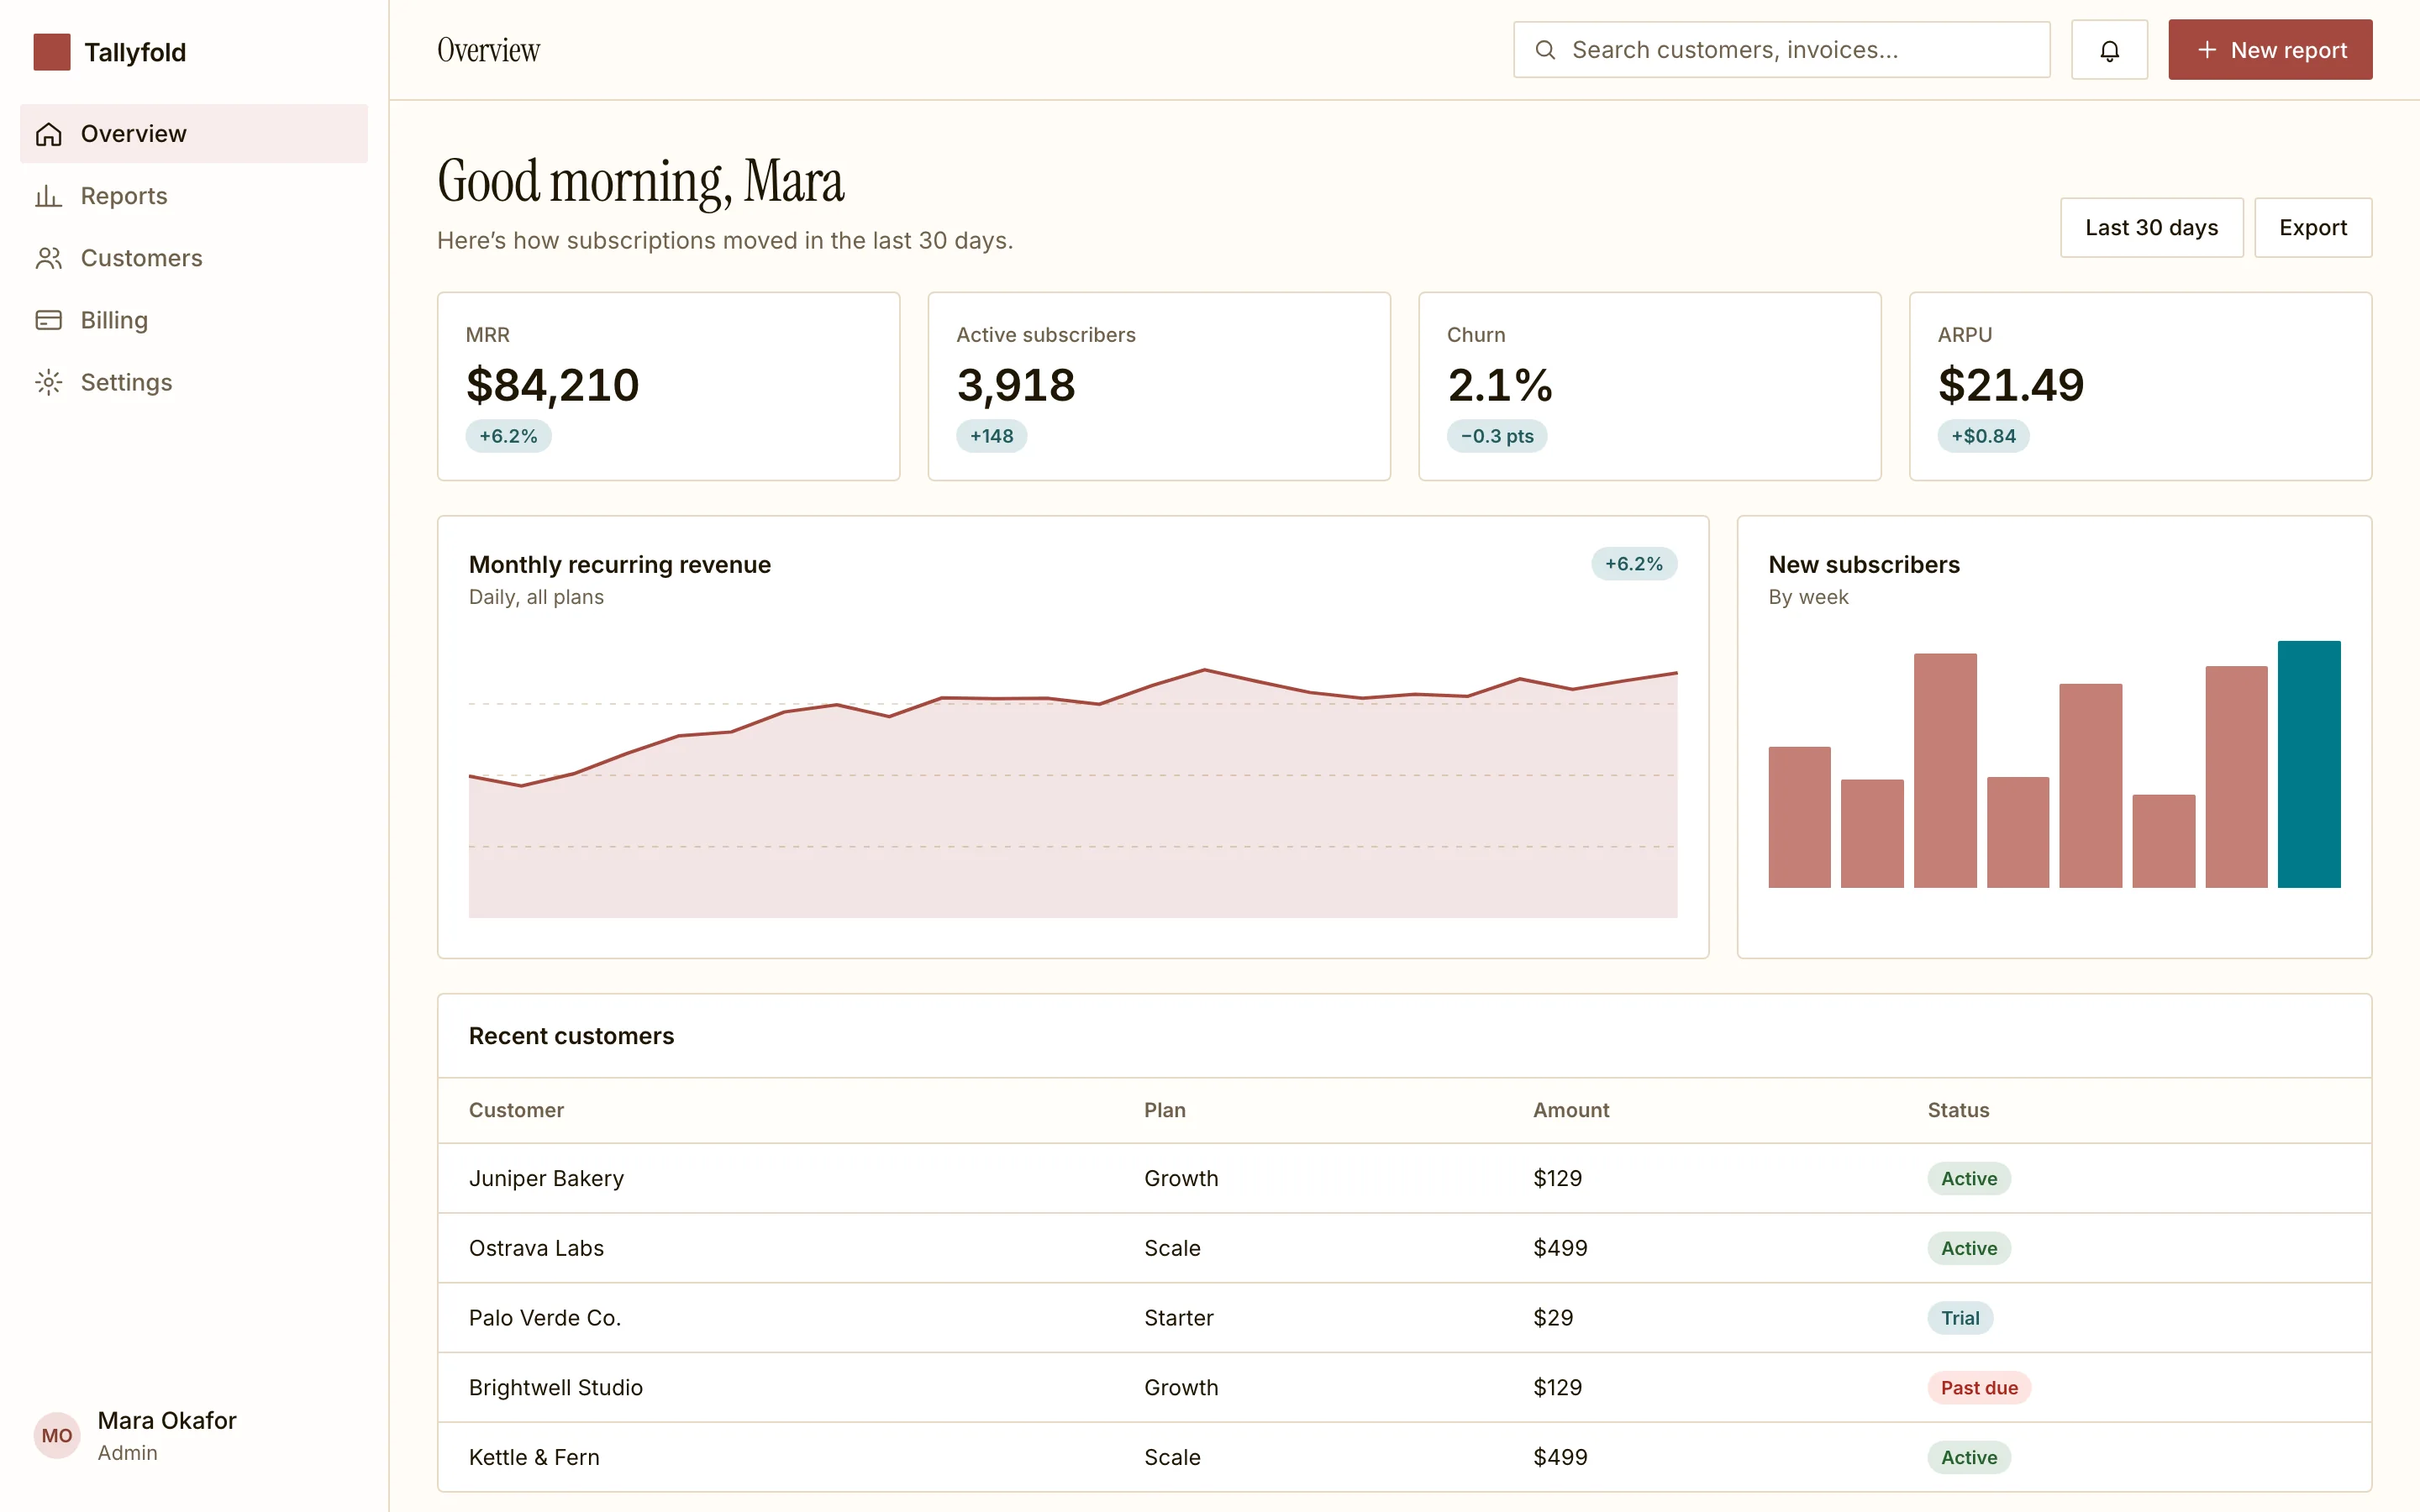
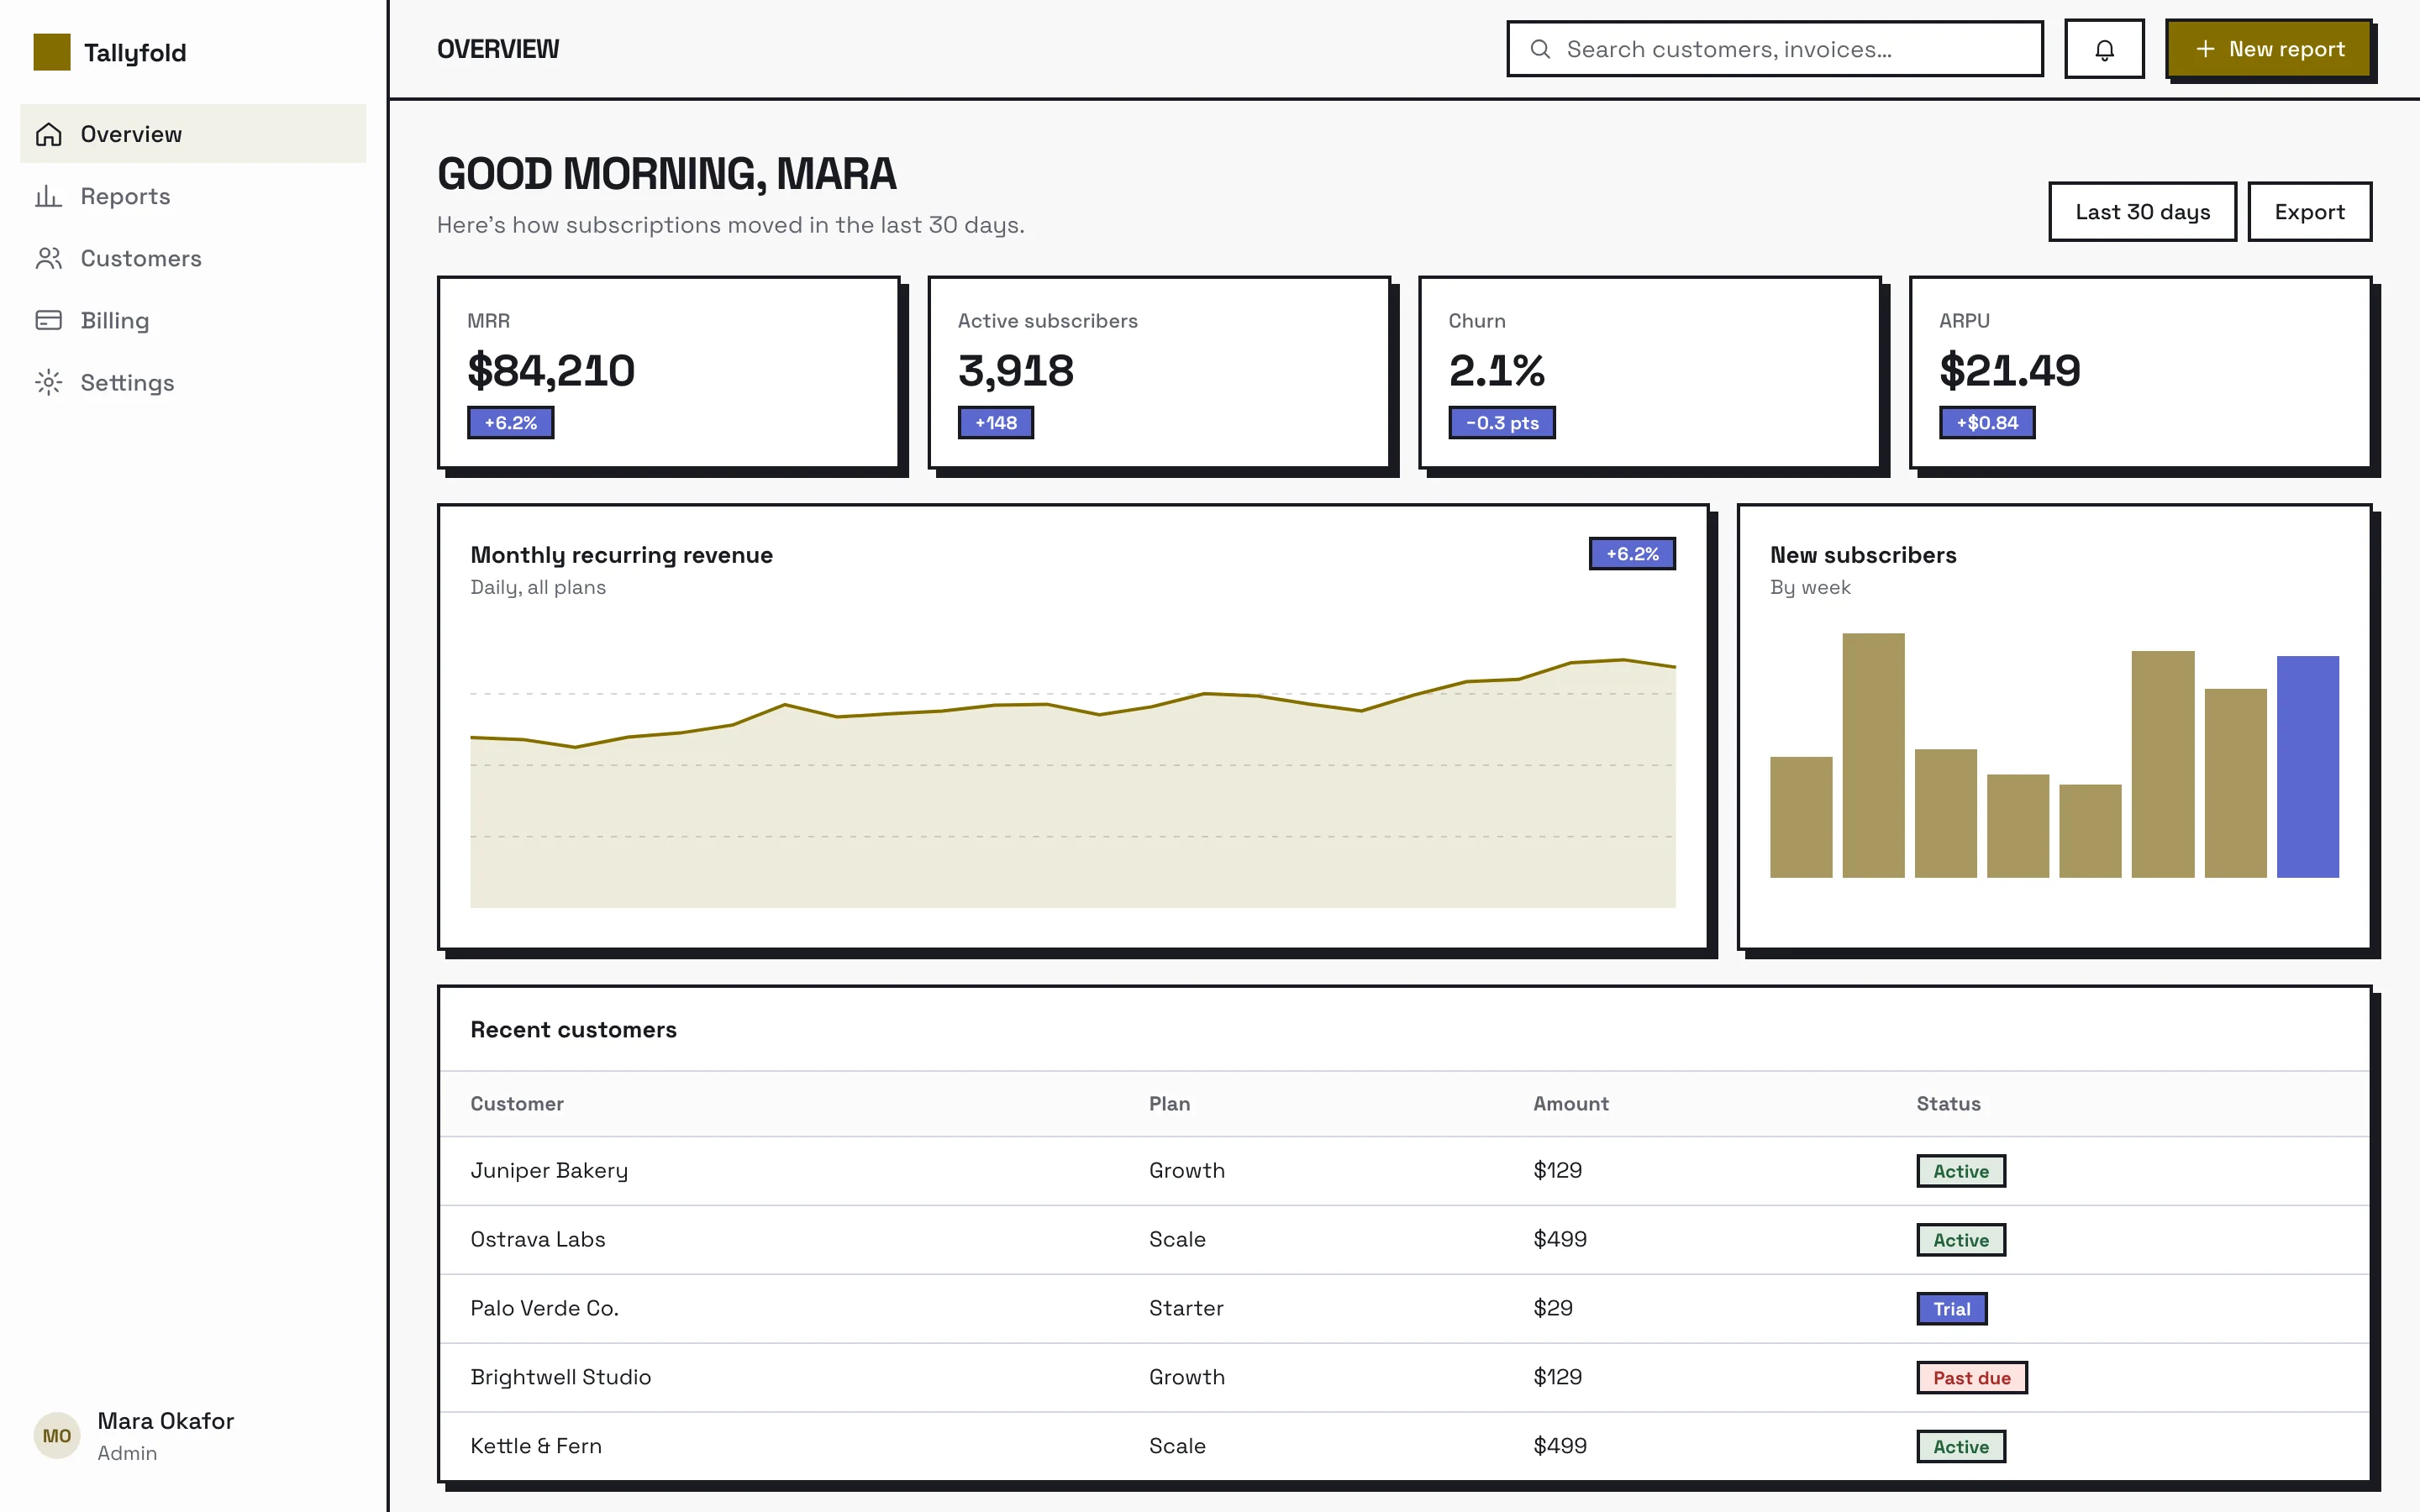
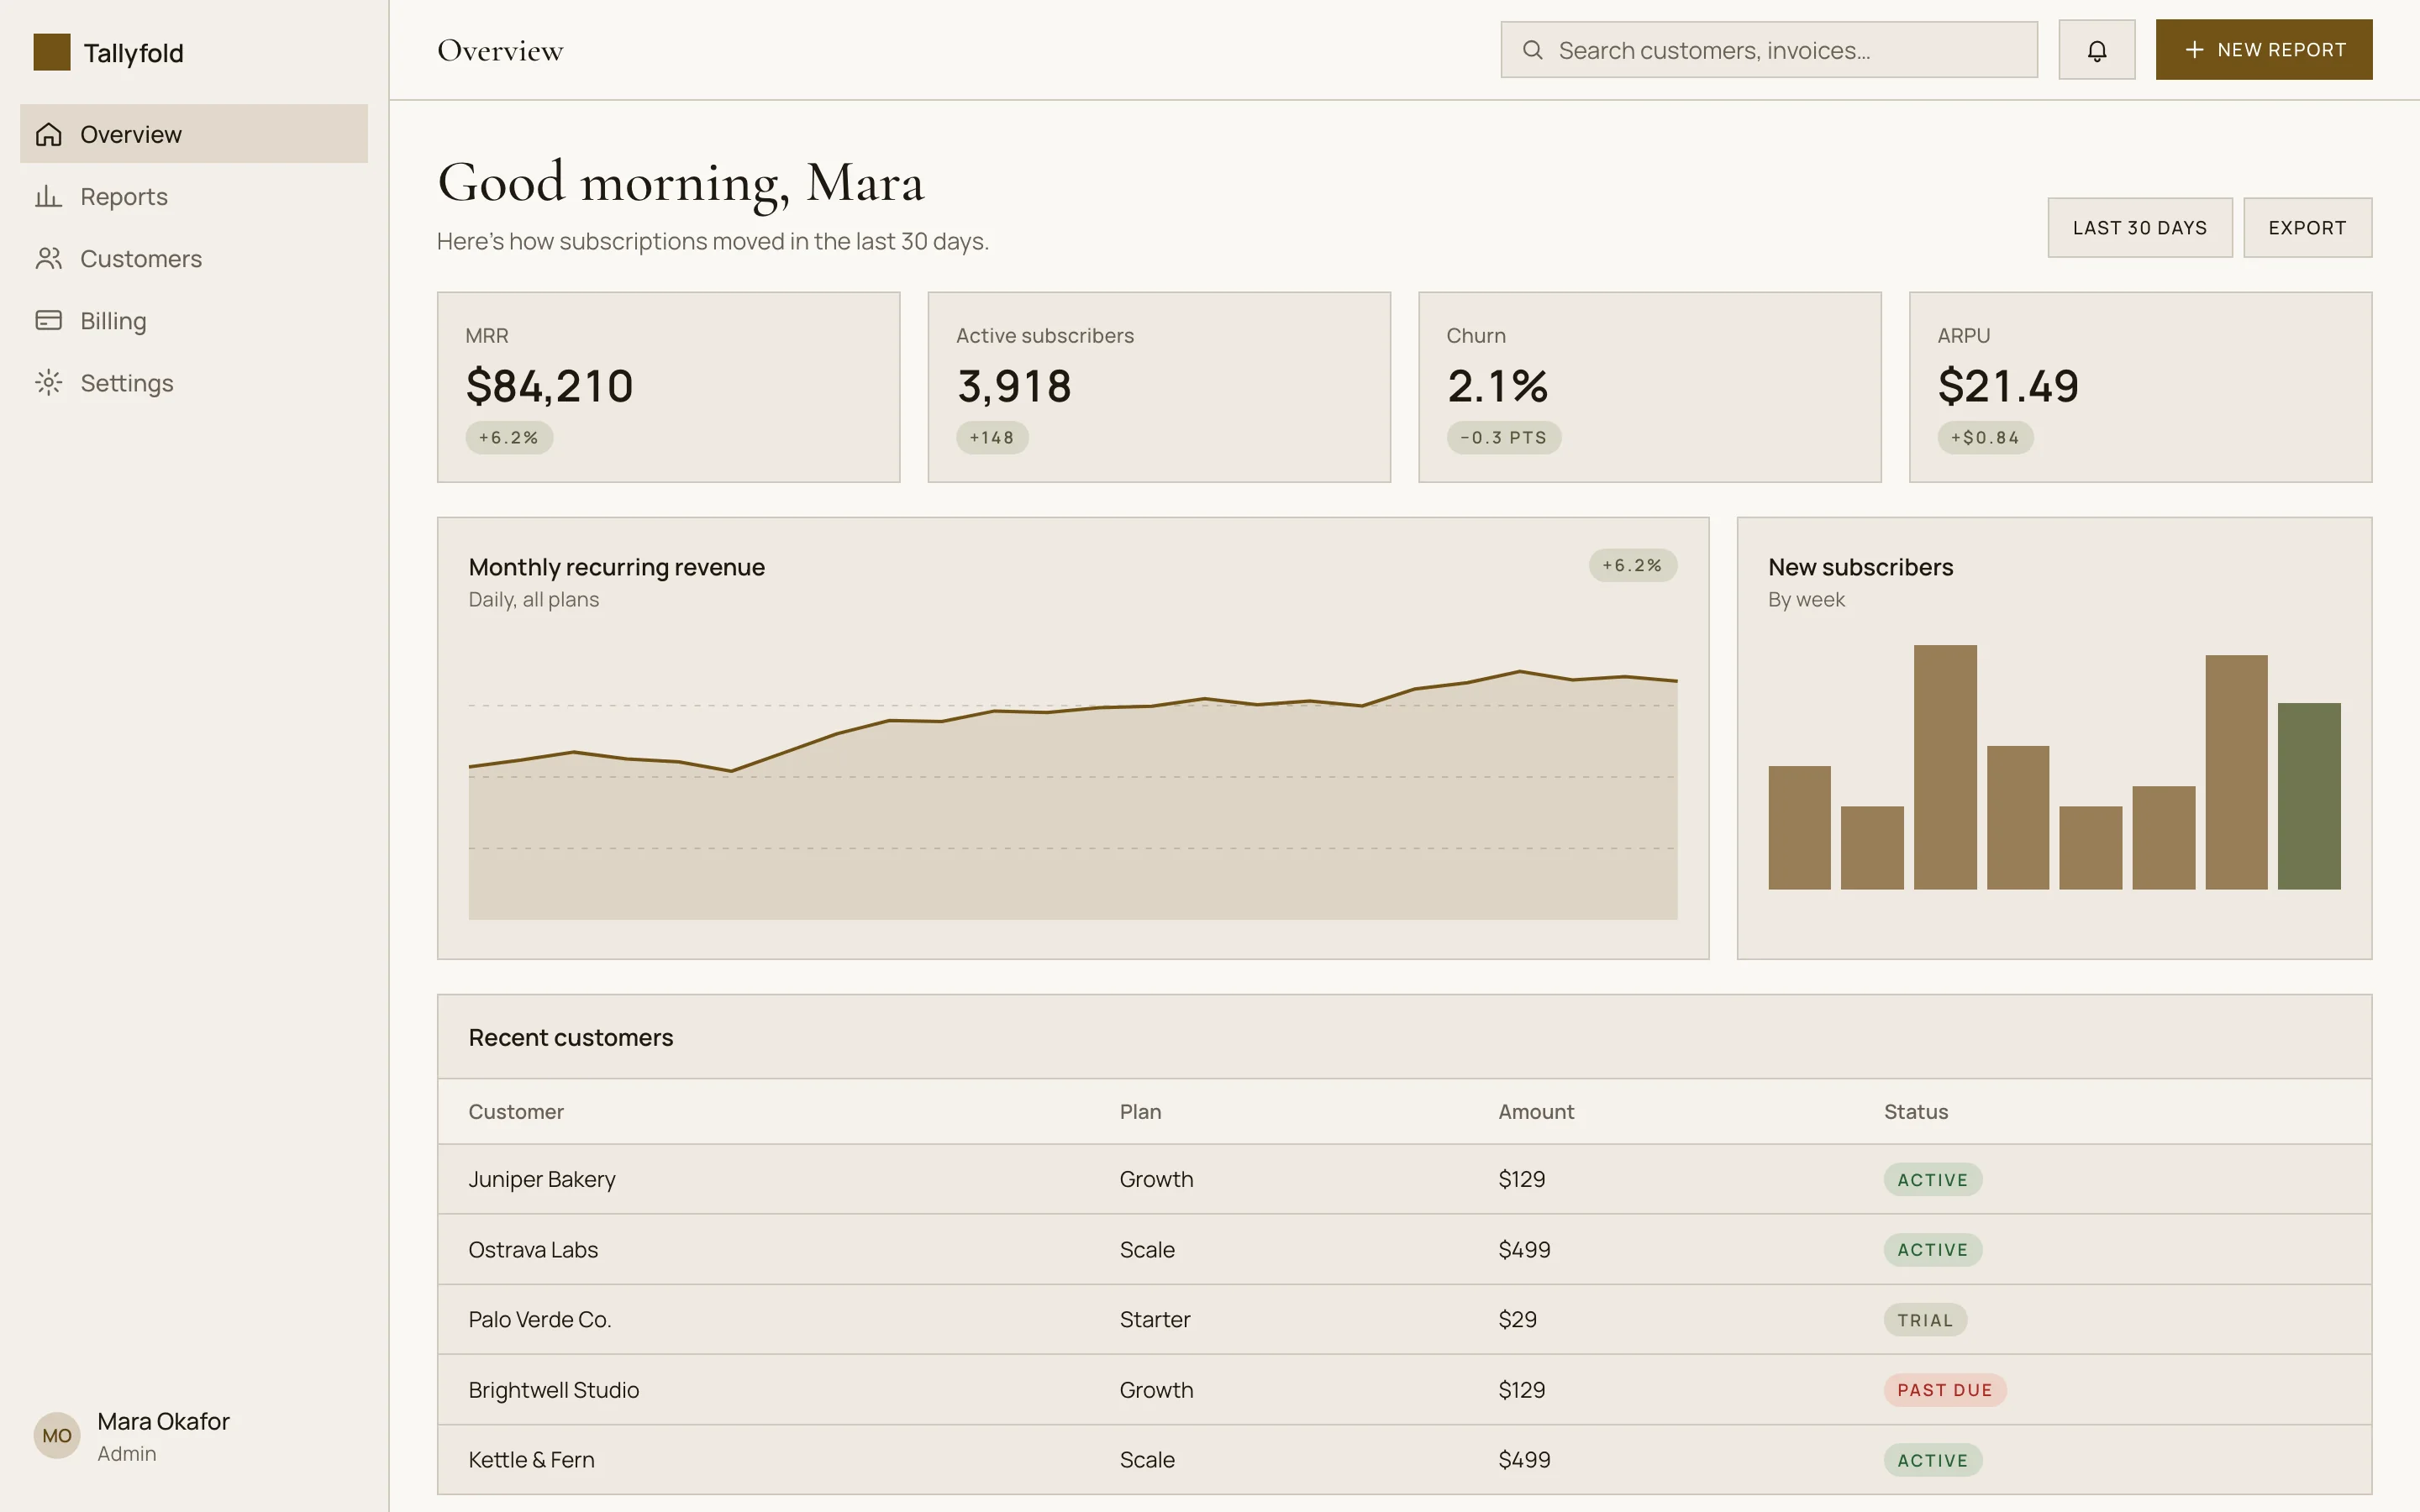
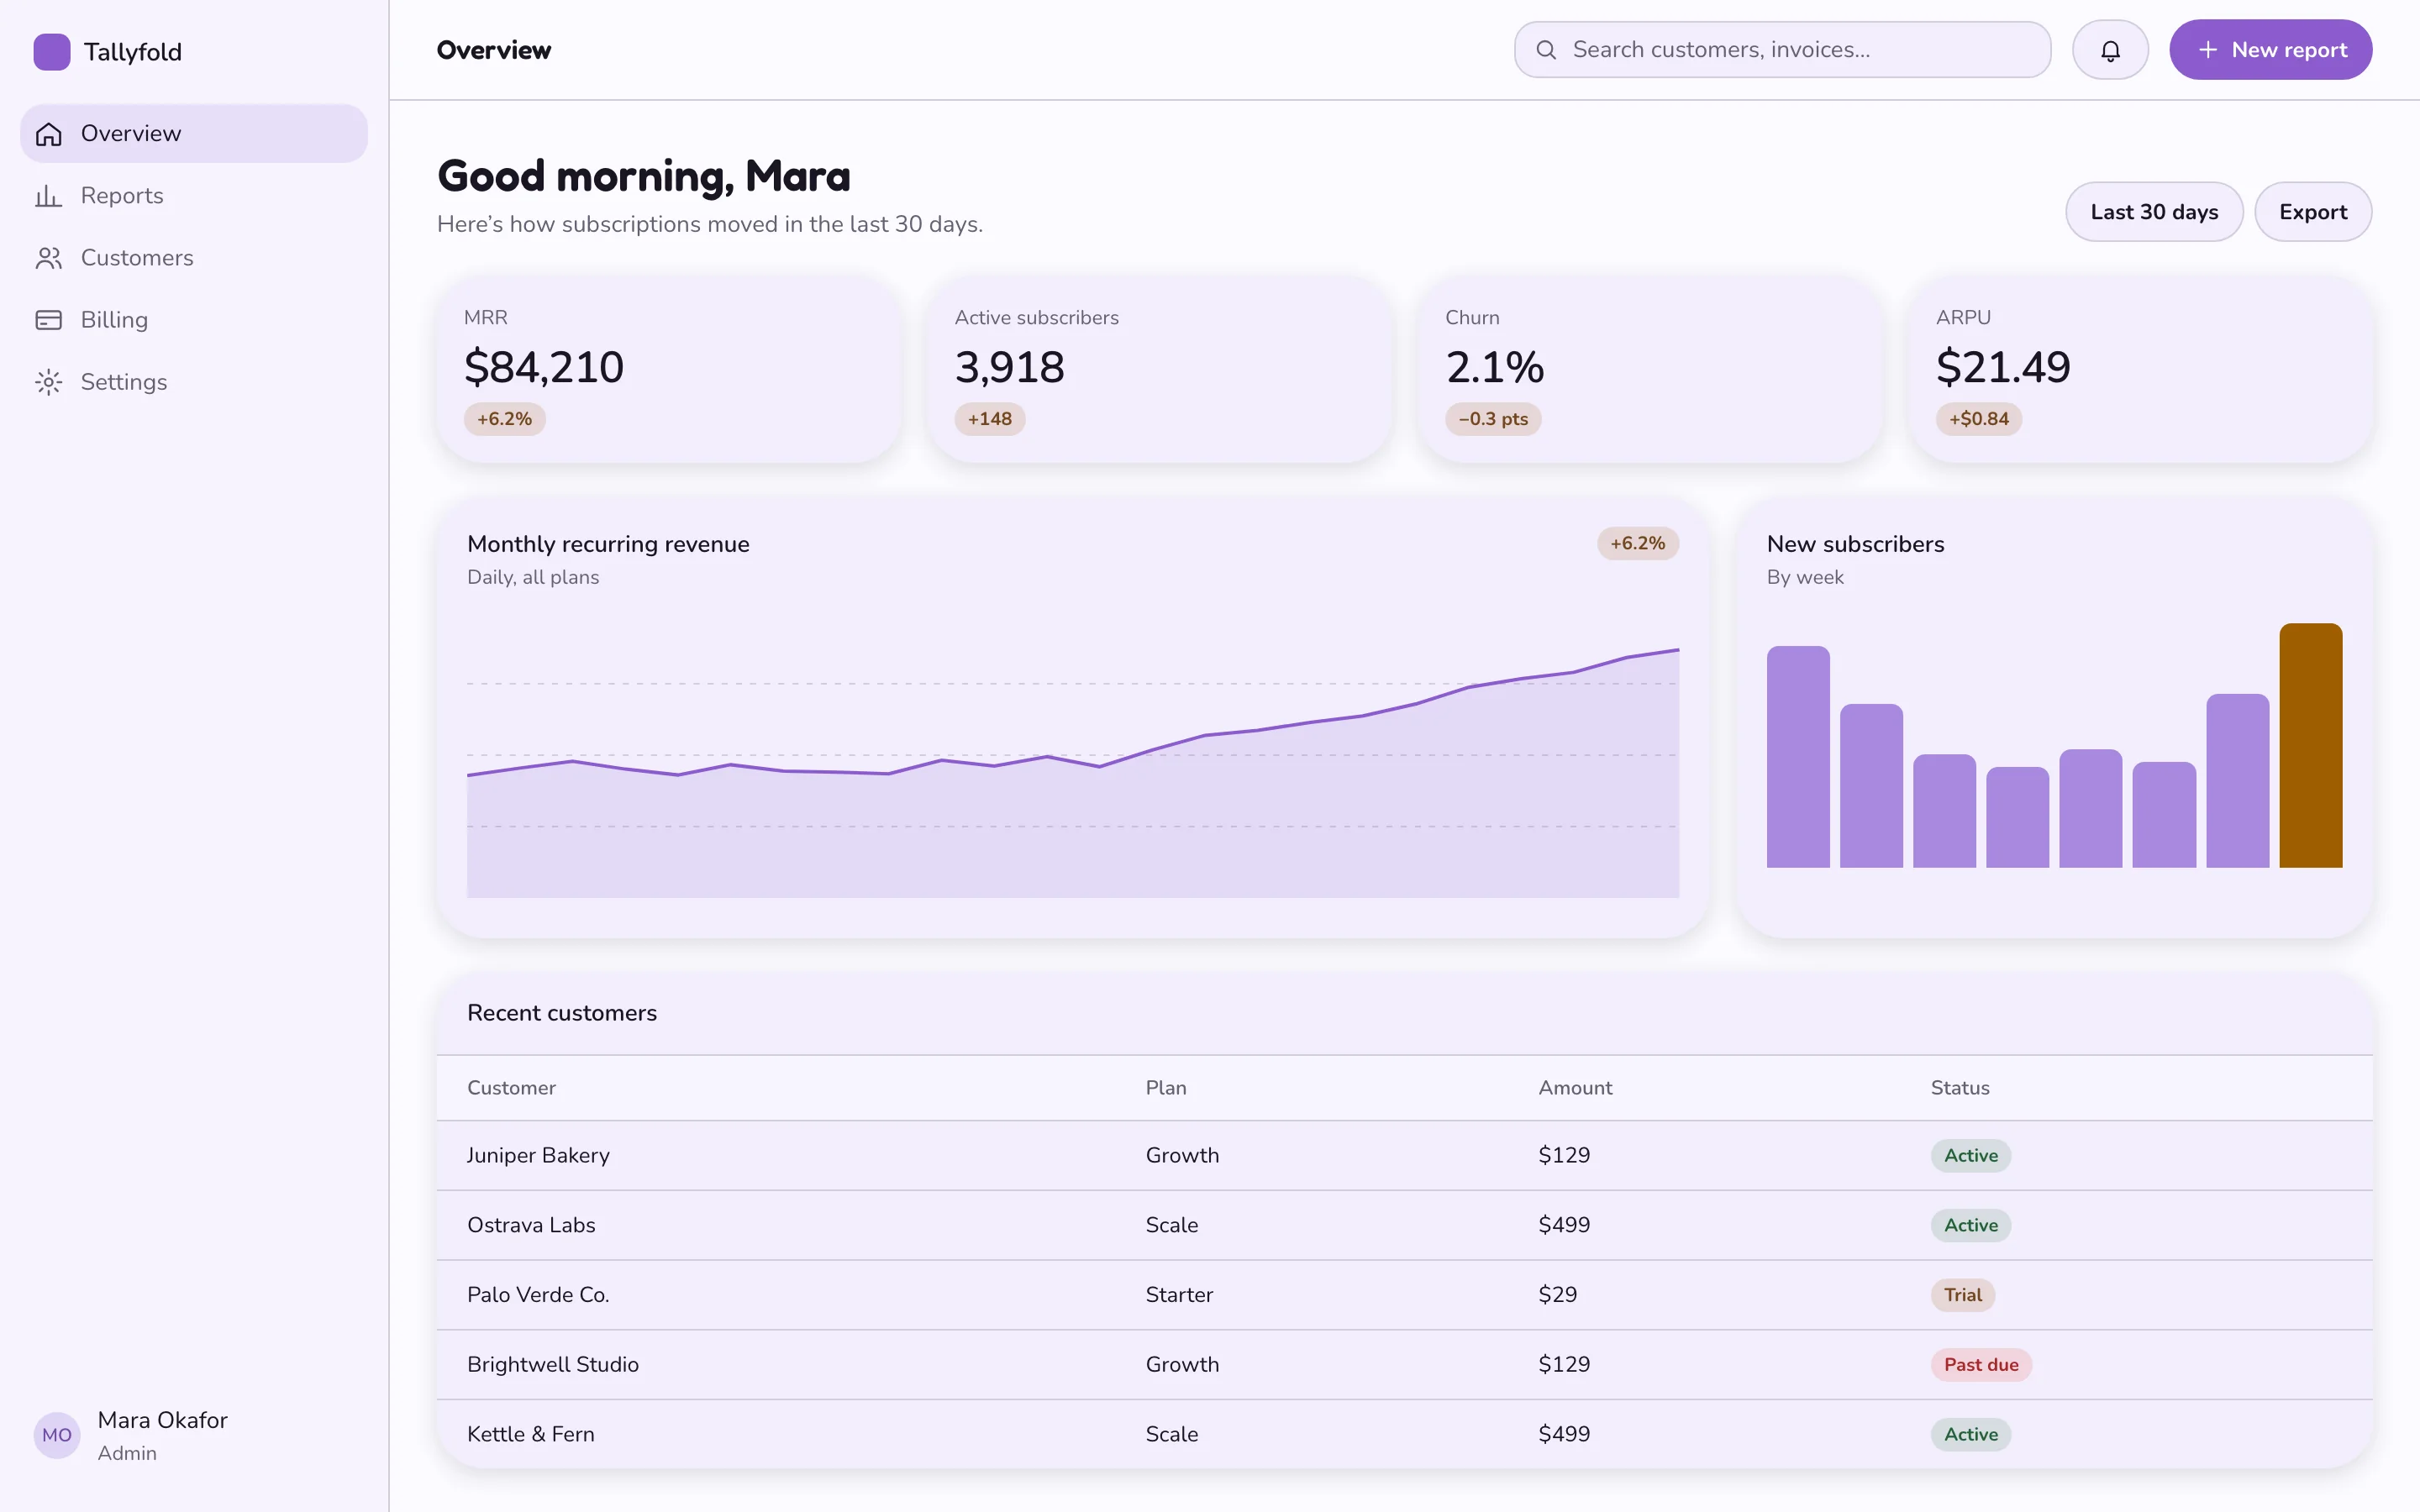
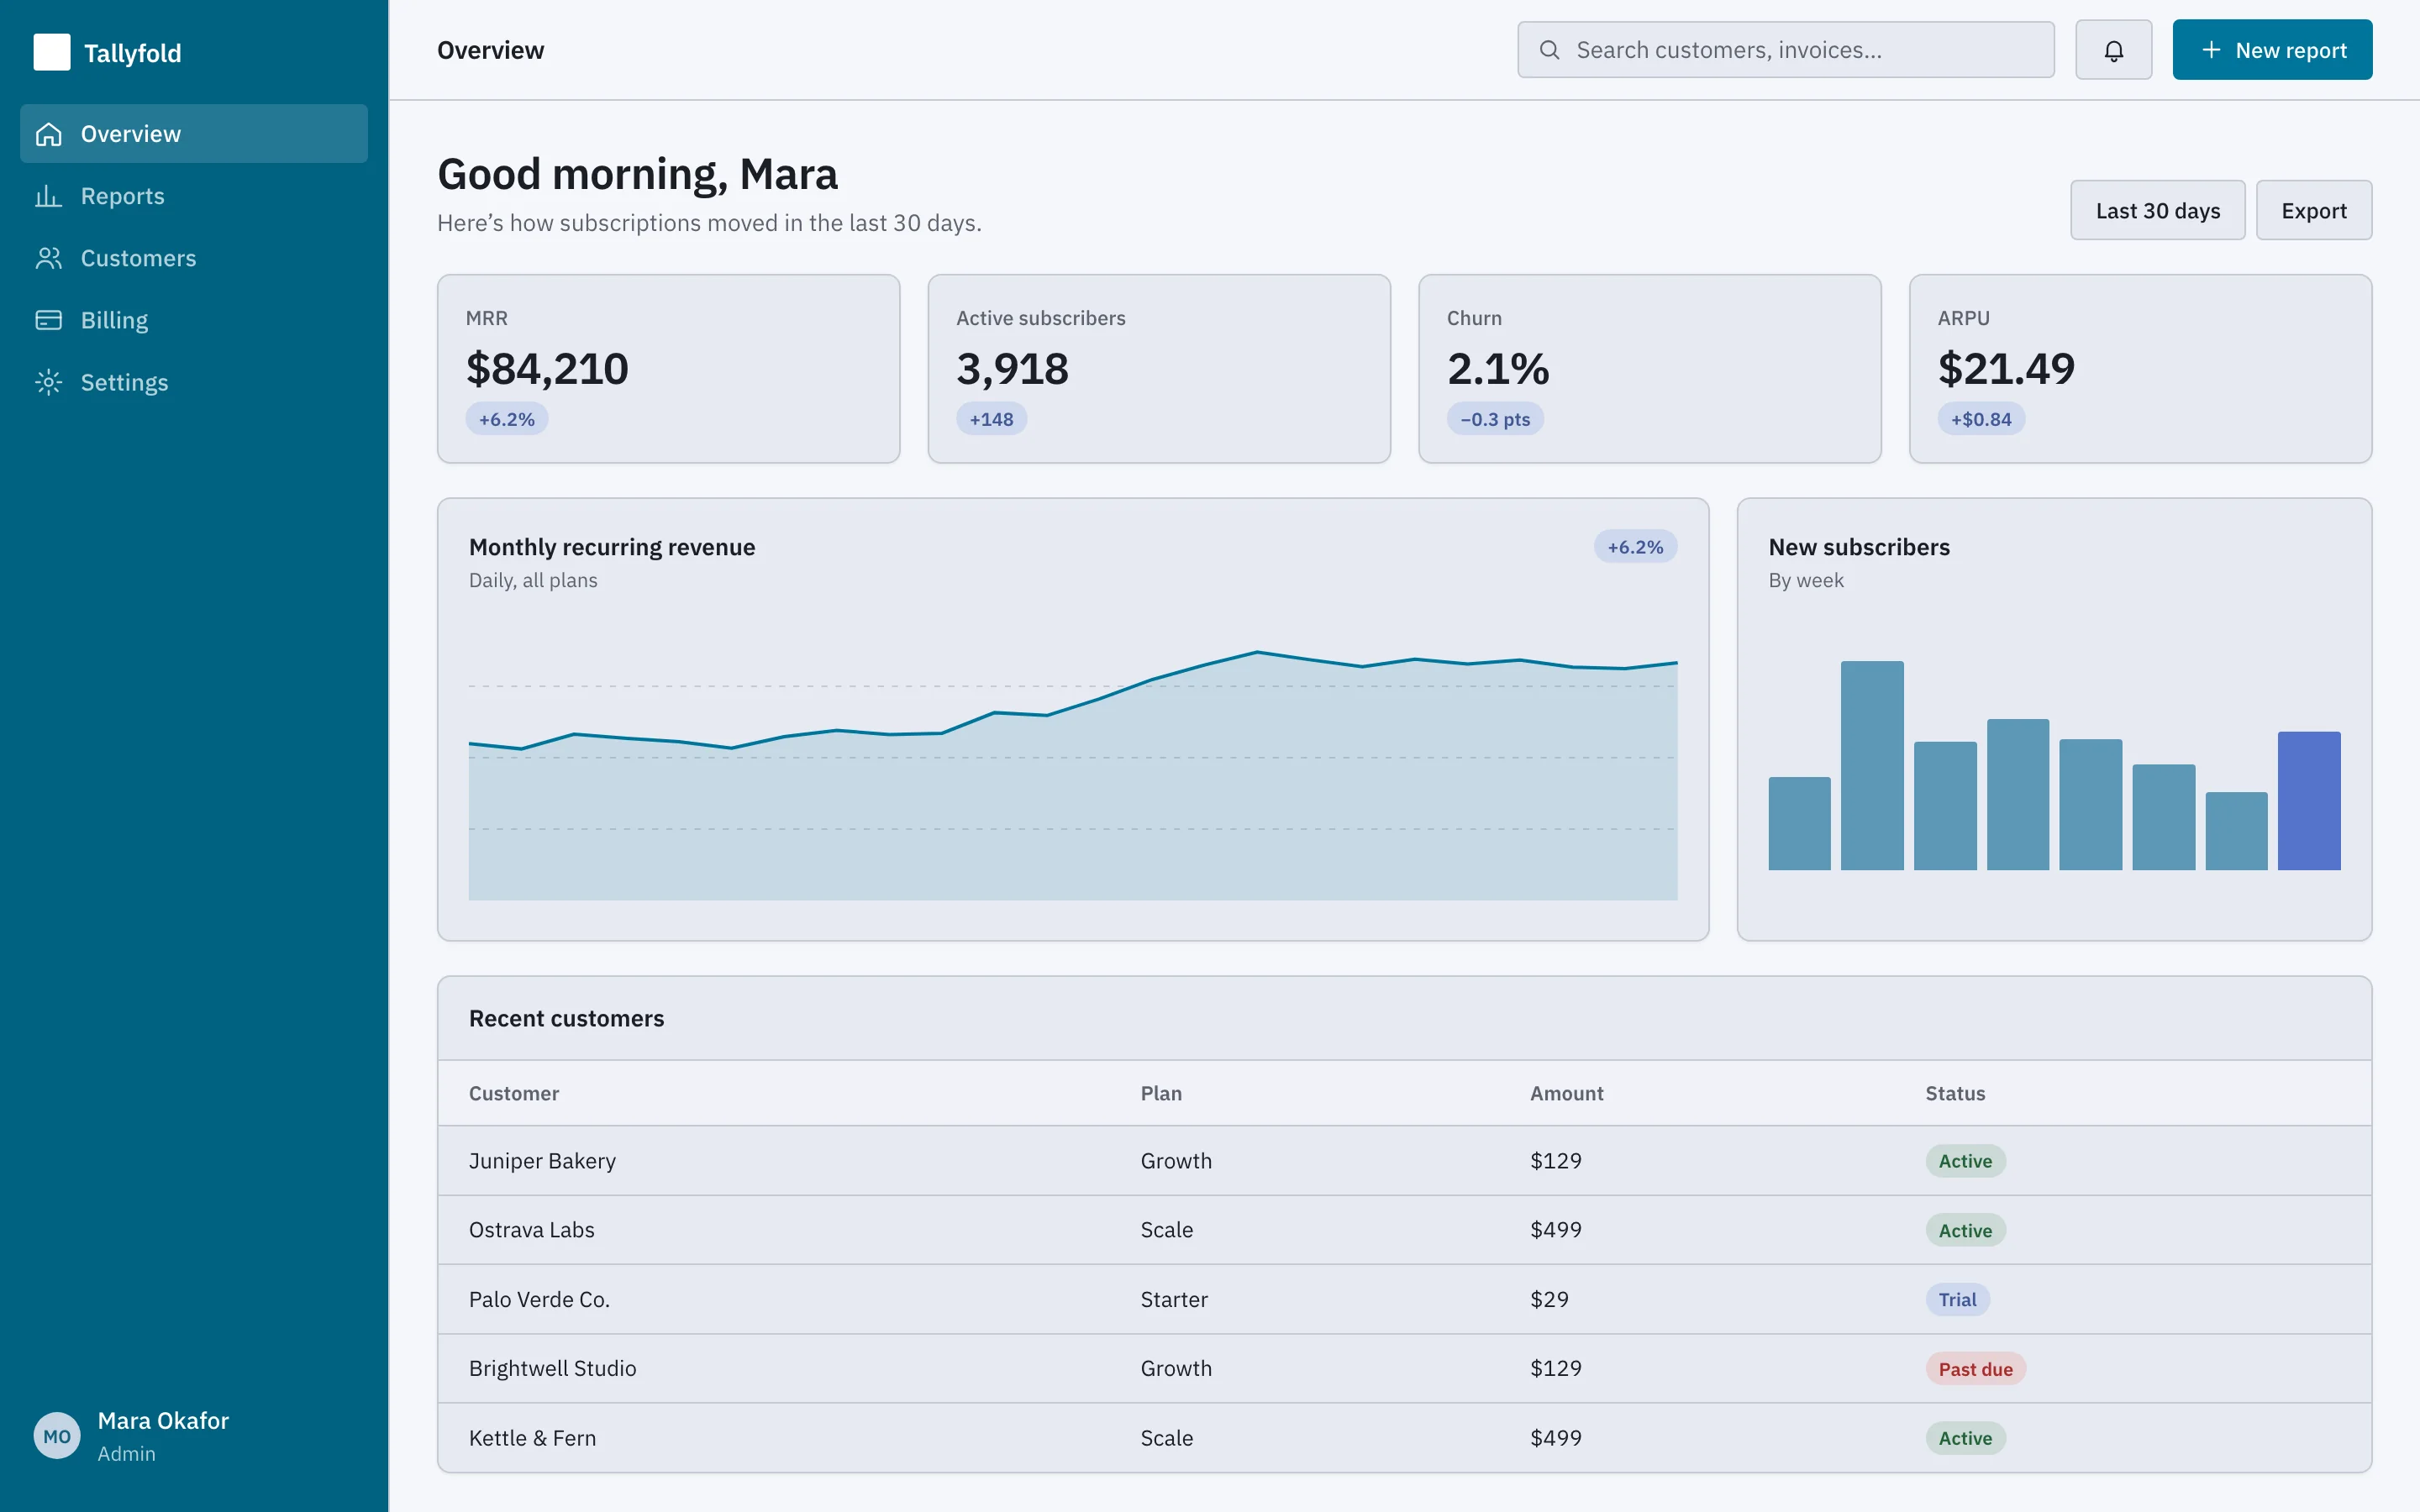
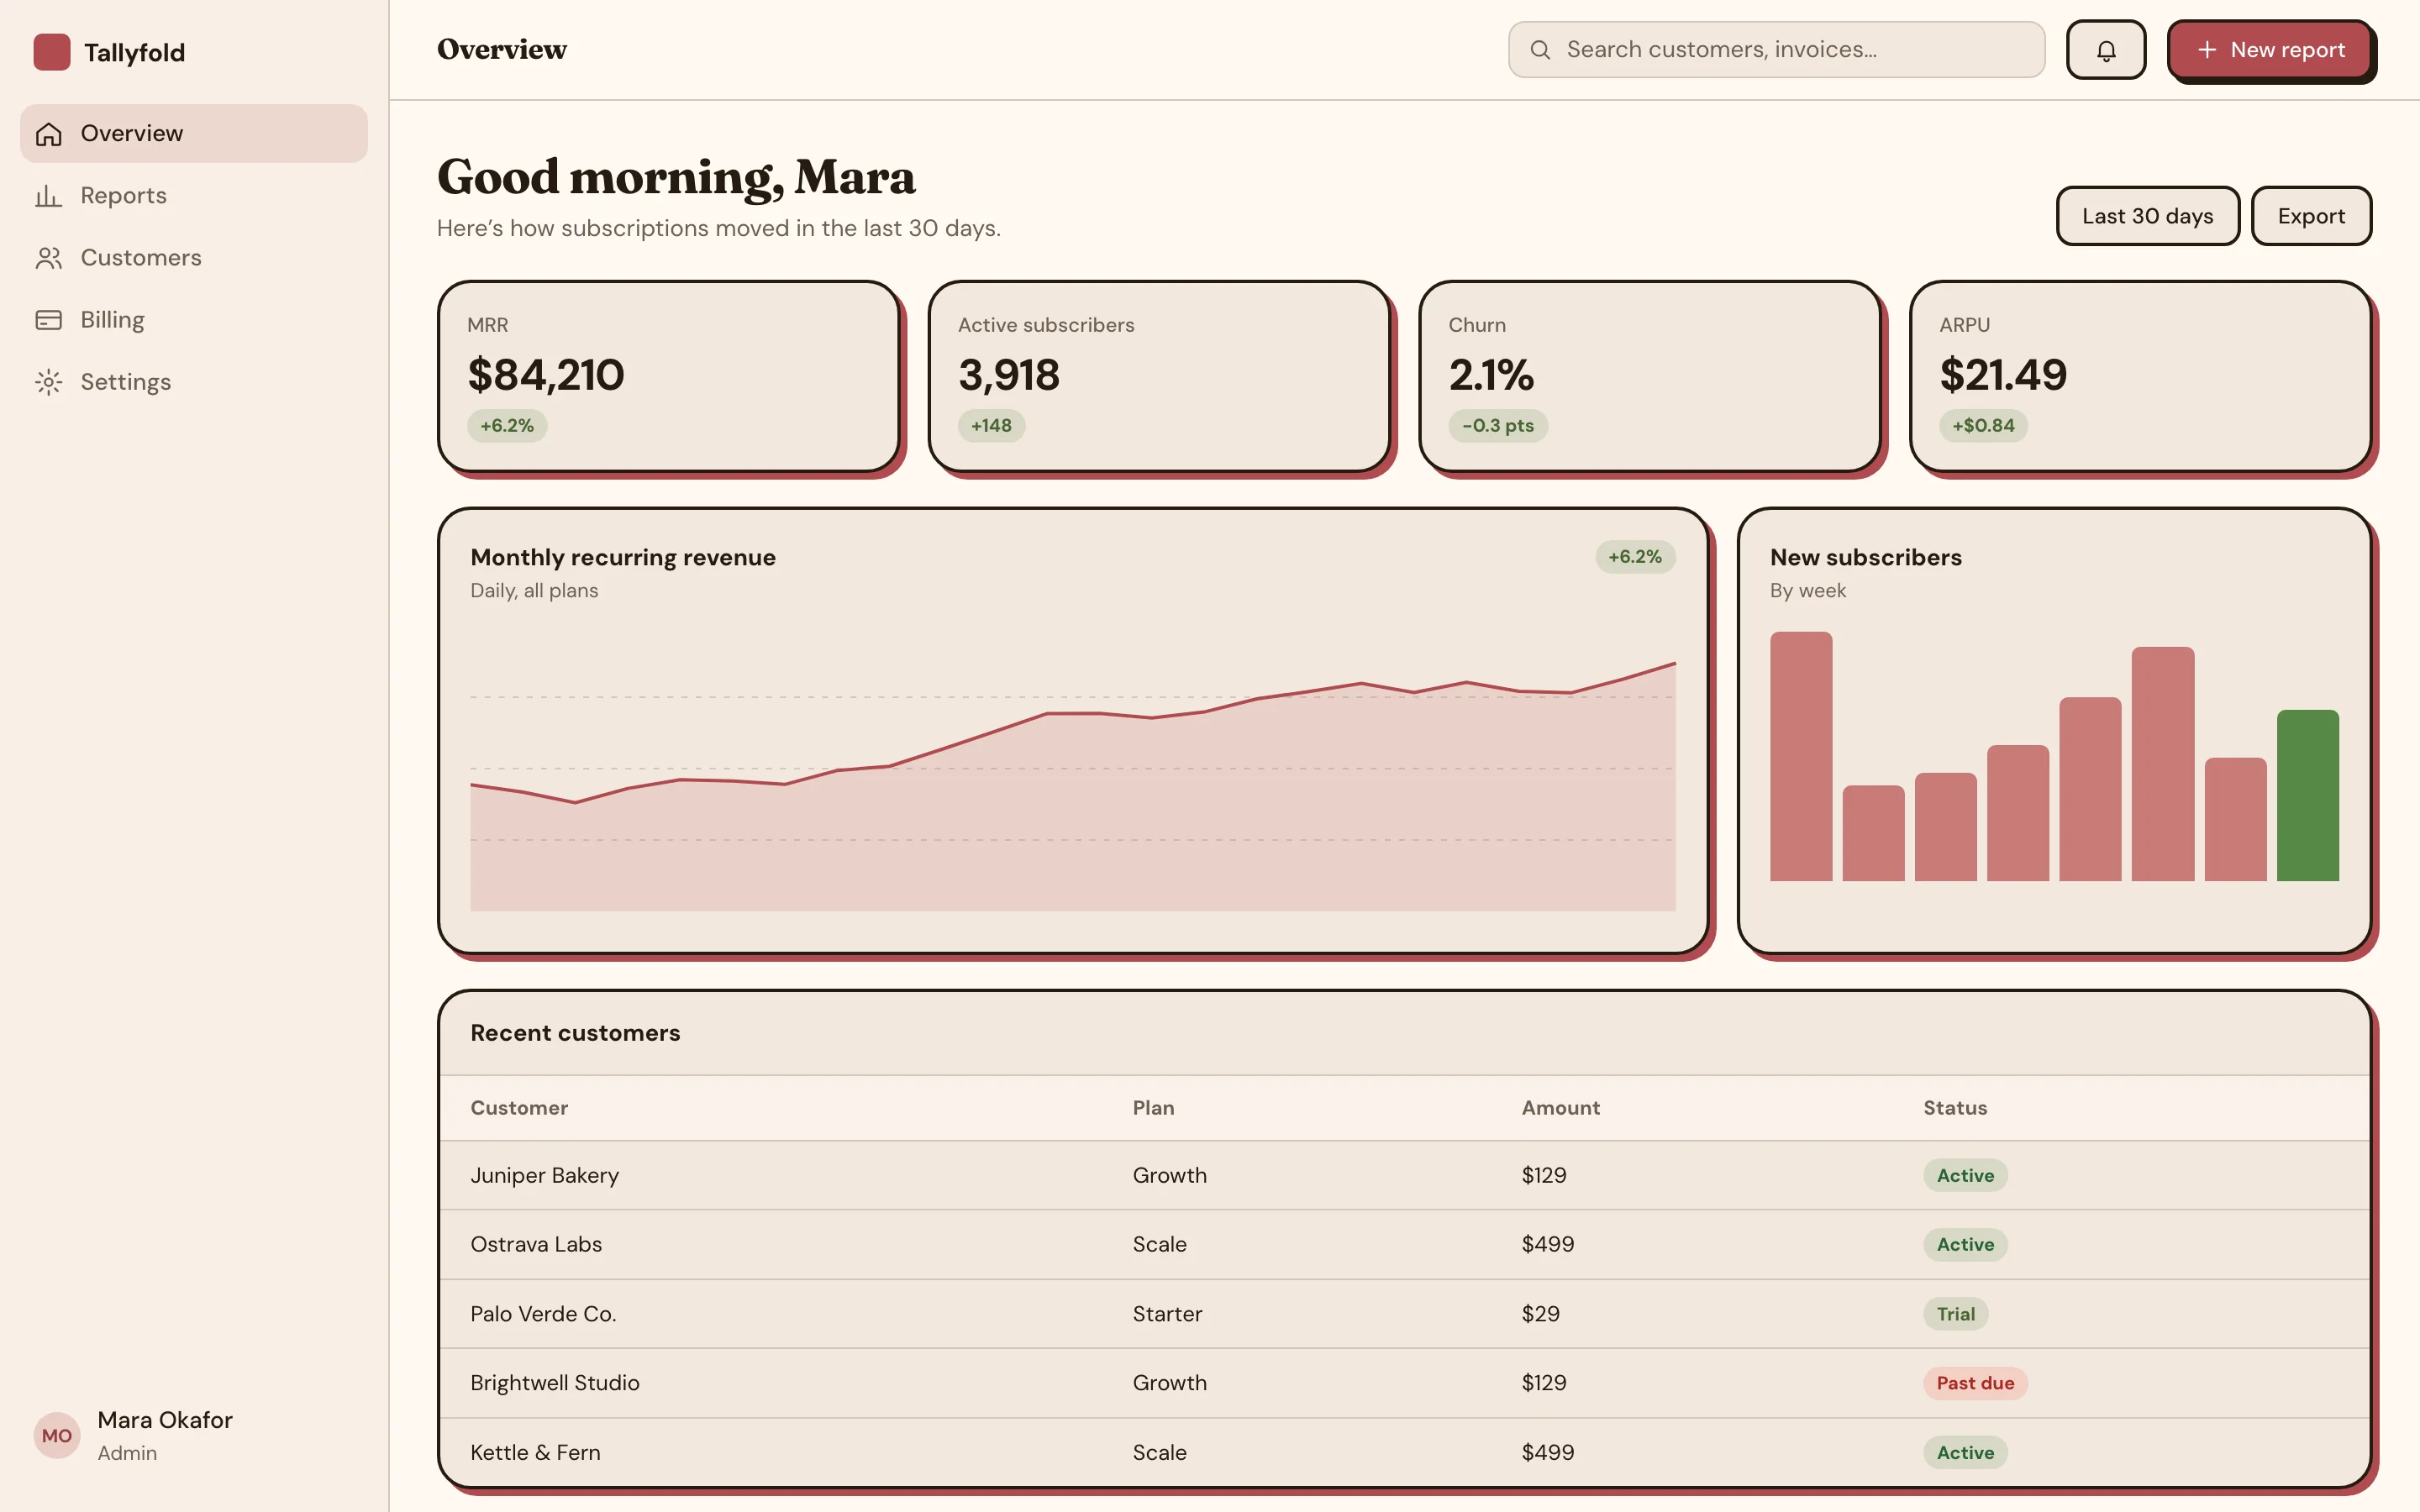
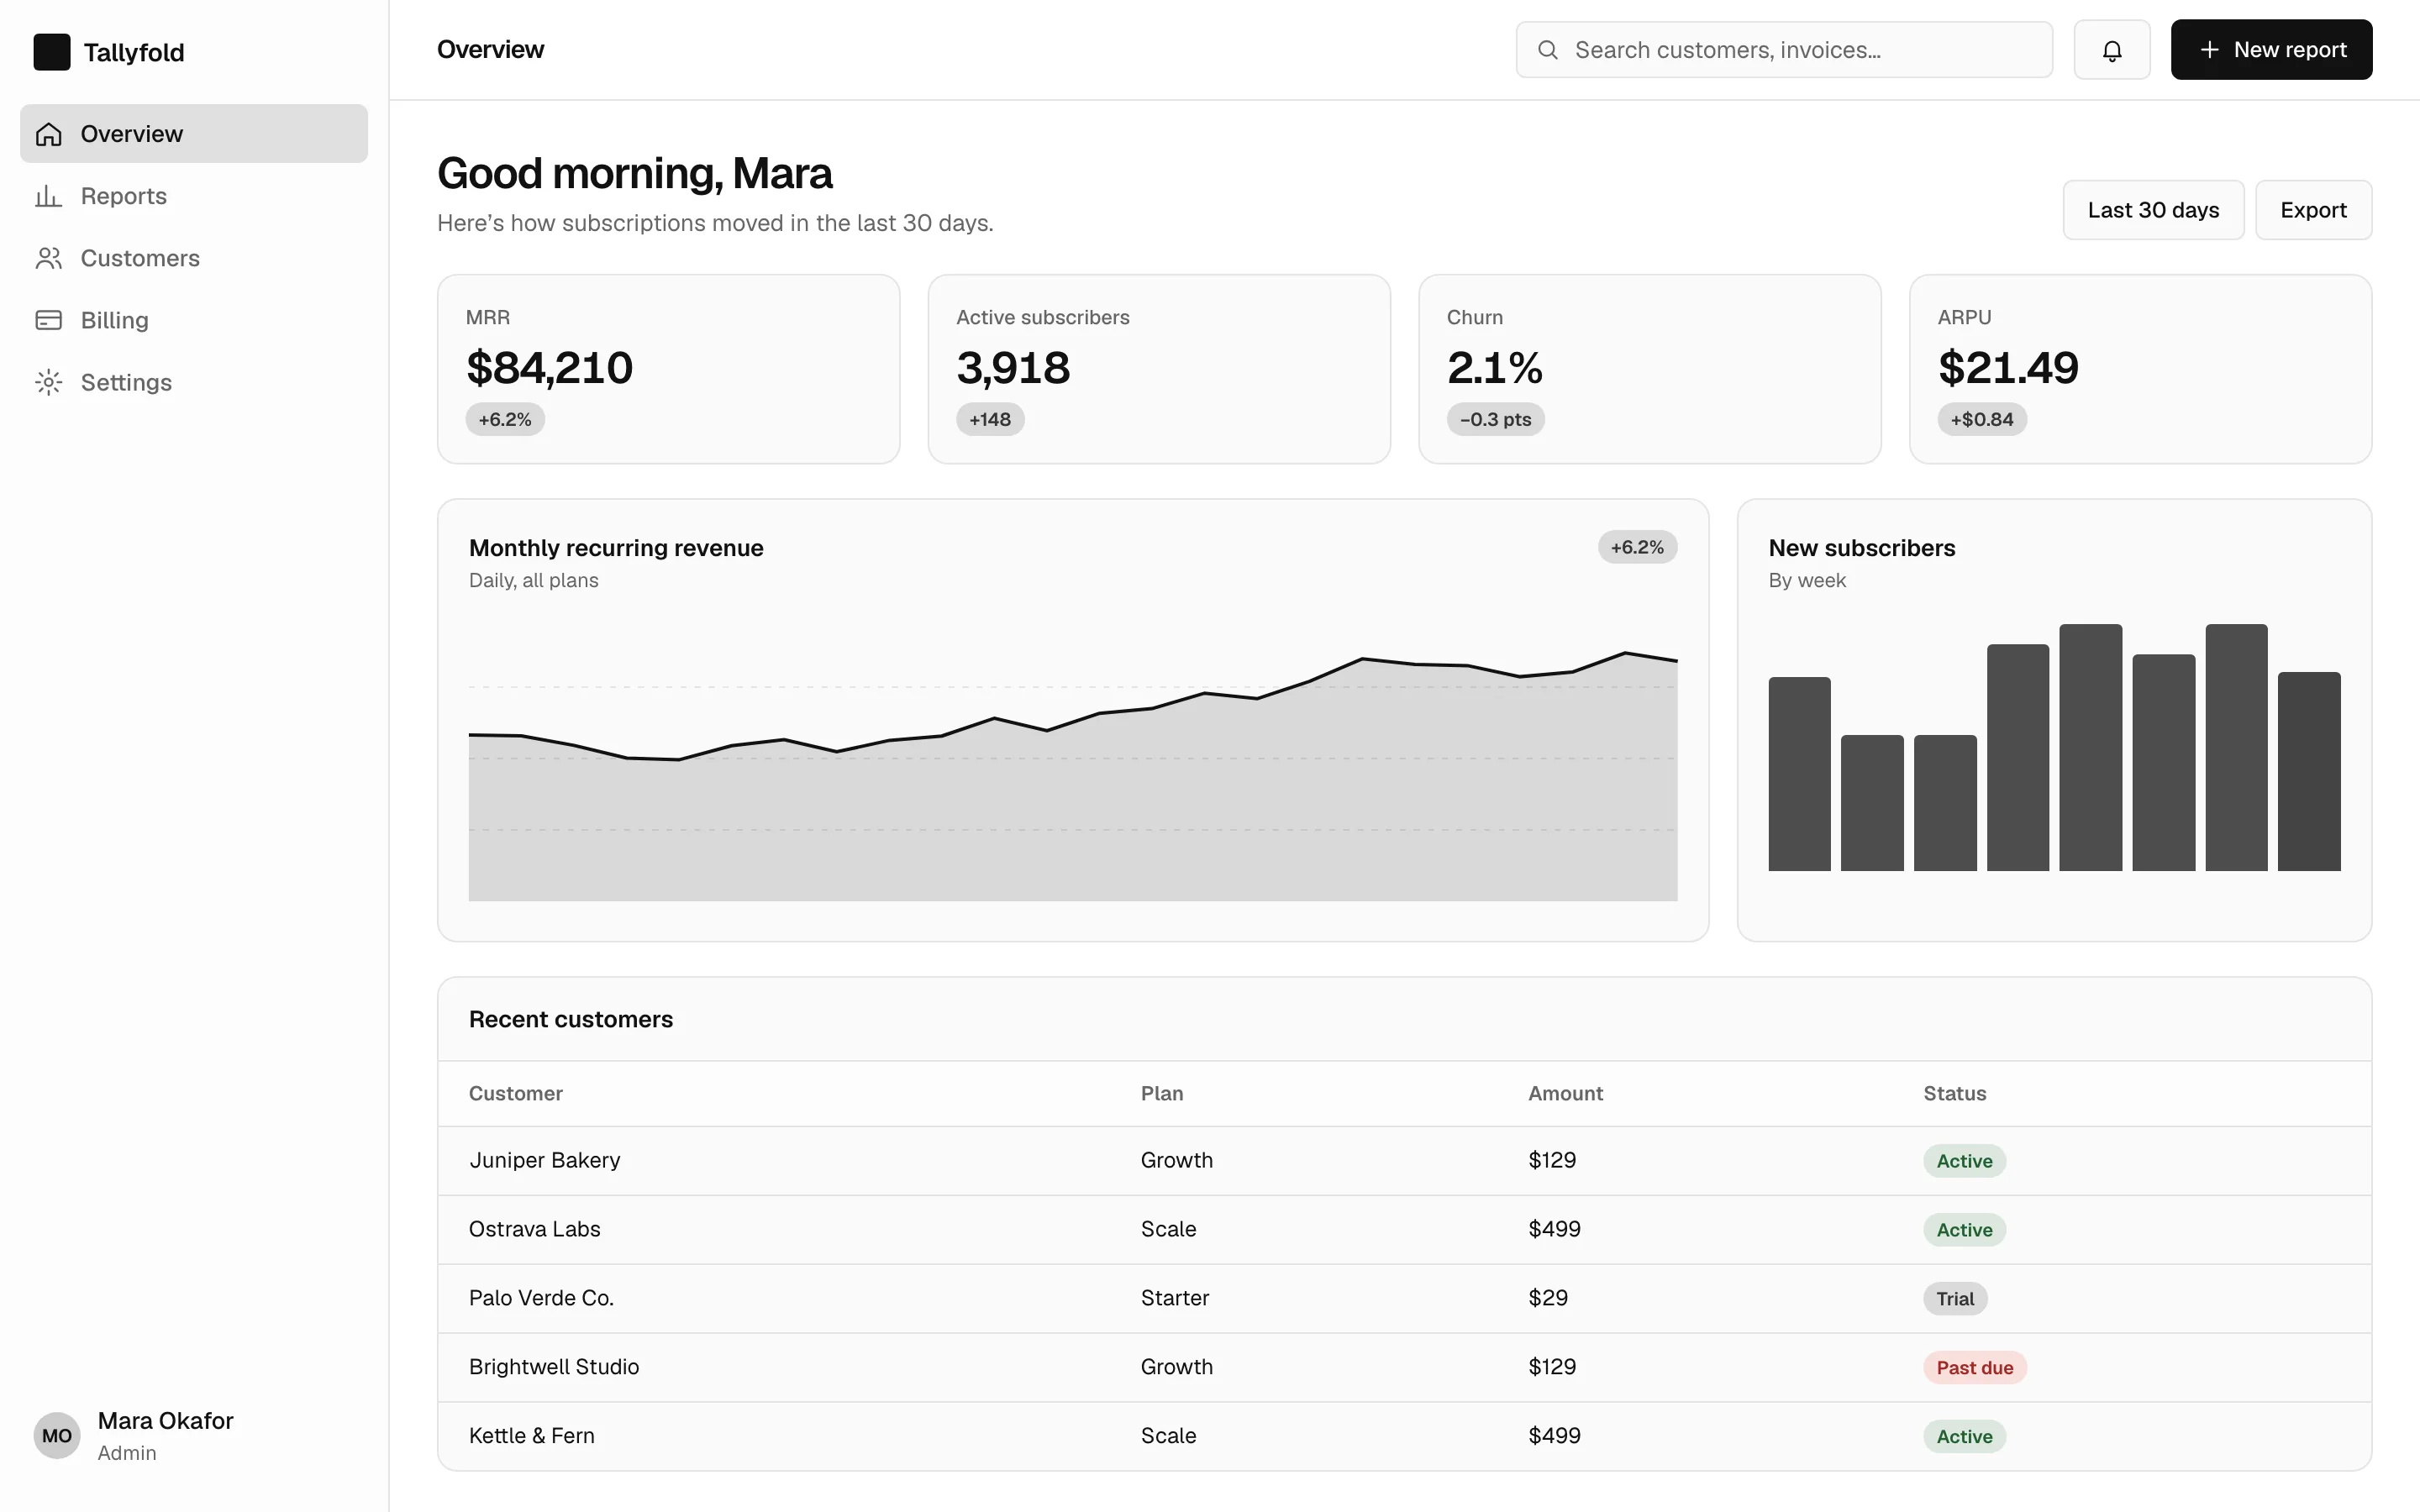
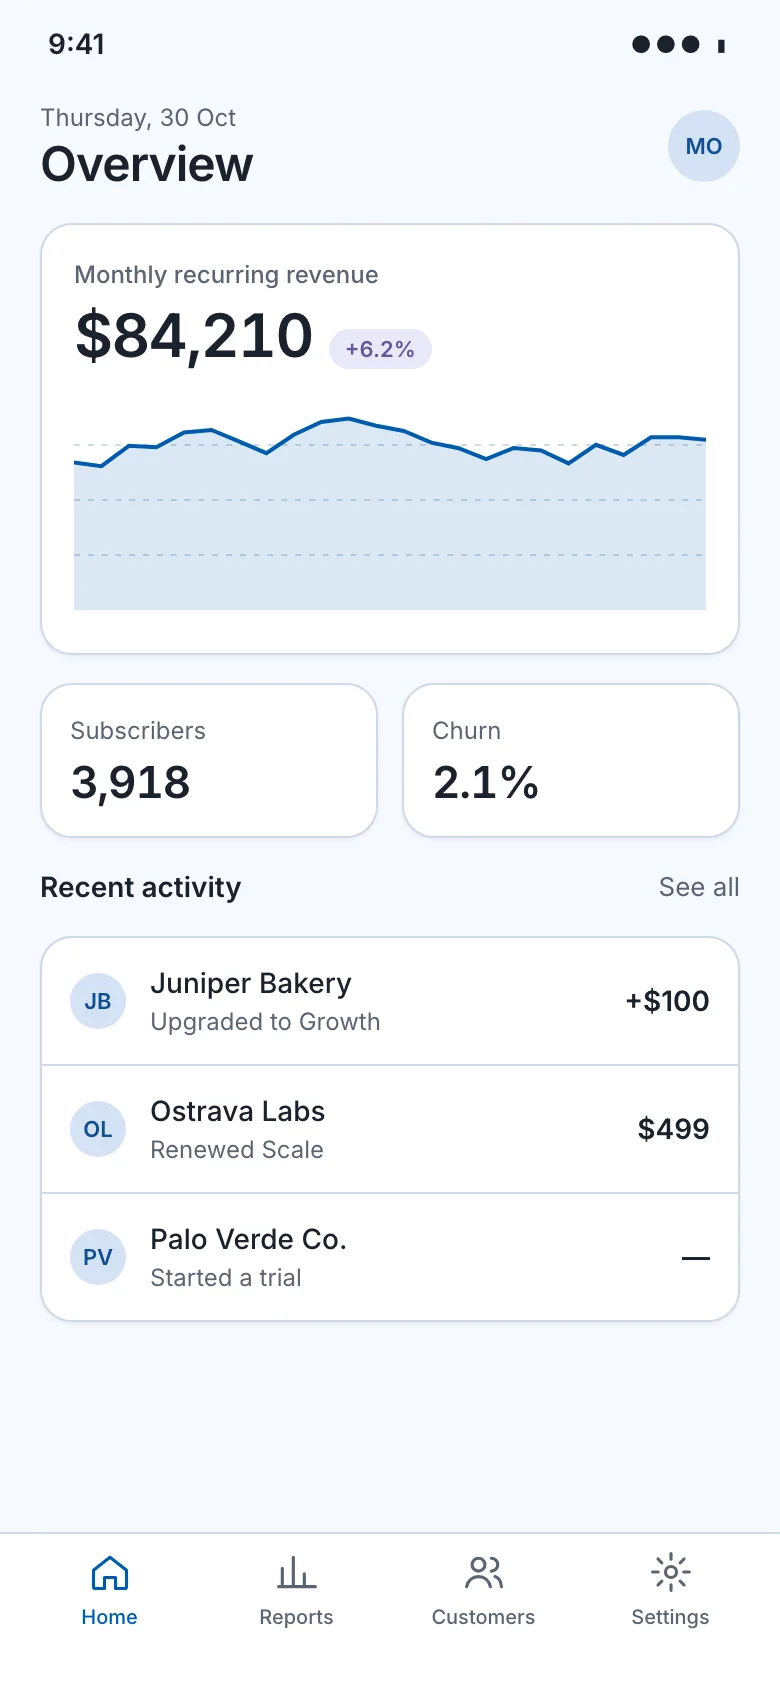
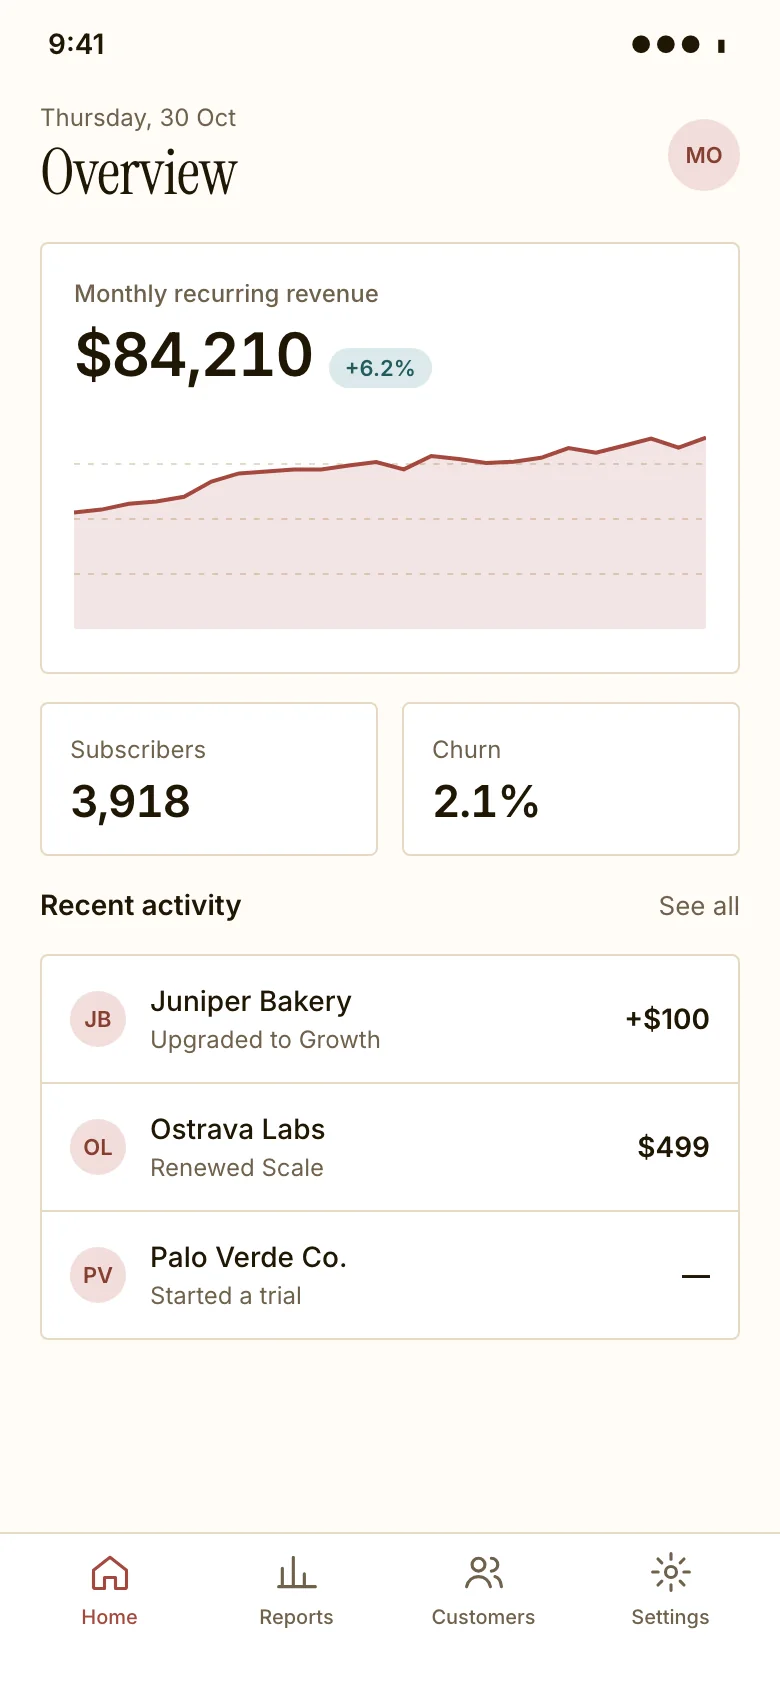
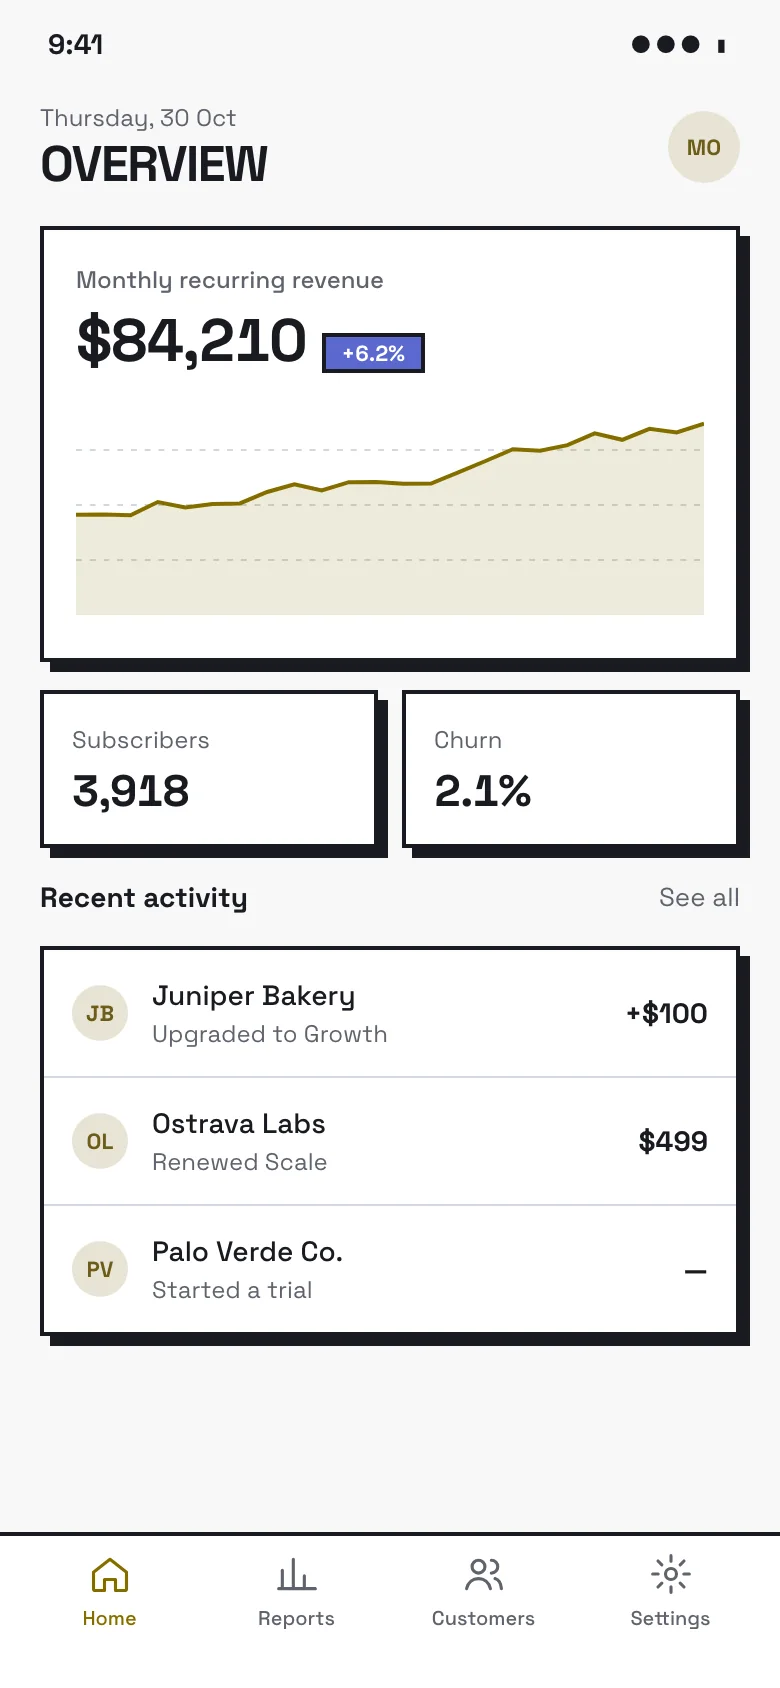
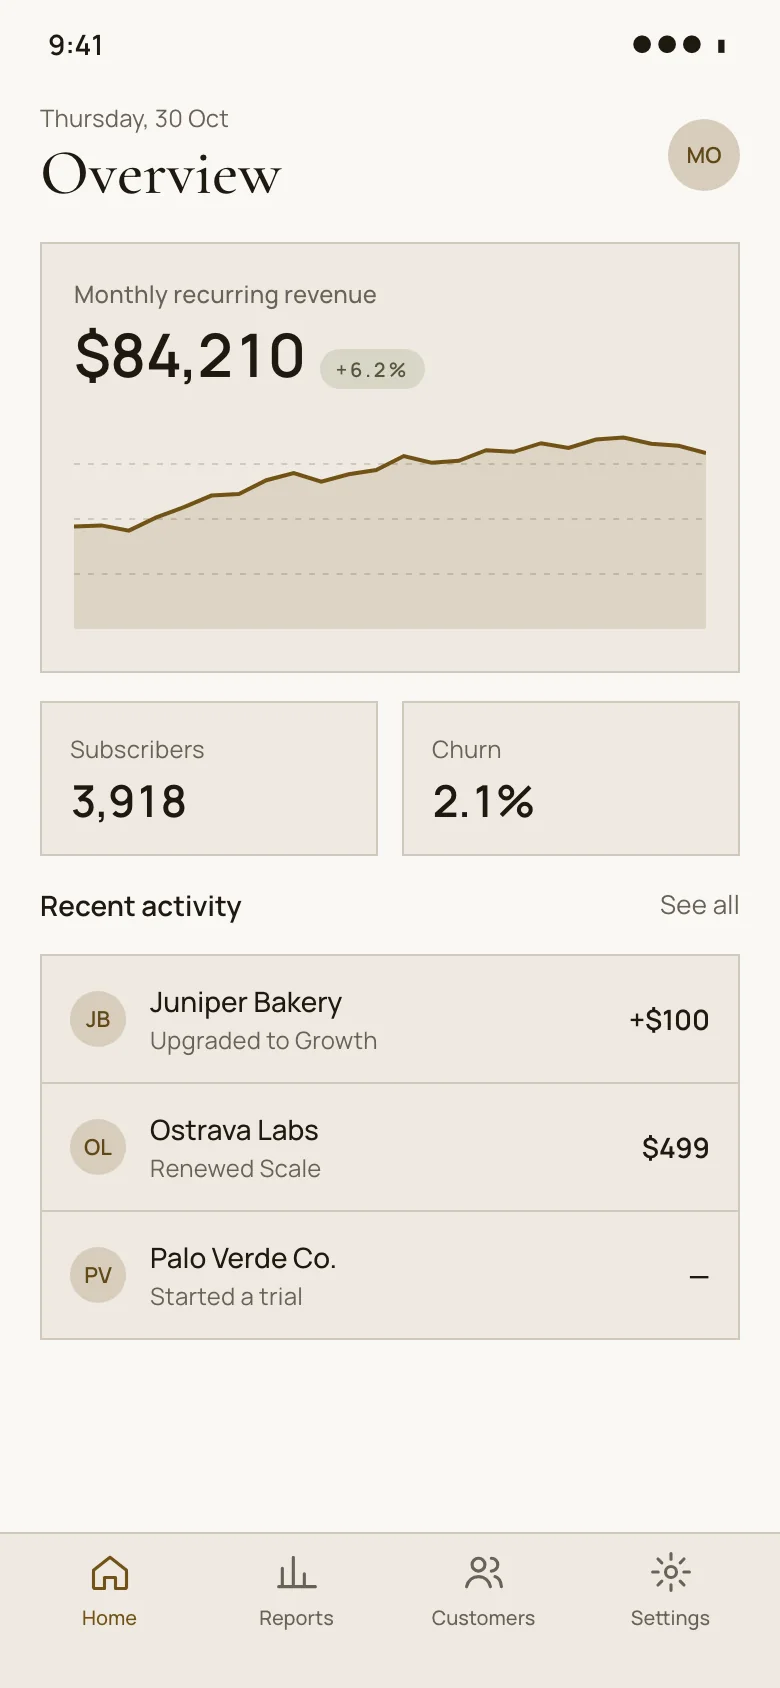
A dashboard gives people a quick read on how things are going before they dig into detail. Our screens combine KPI cards, a revenue area chart, a weekly bar chart and a recent-customers table in a finance context, laid out for web and mobile across eight visual styles, each with light and dark themes, HTML code and design tokens. Every example is an original design that comes with its HTML code and a DESIGN.md of colour, type and spacing tokens, in light and dark. Free to use and adapt.
16 examples
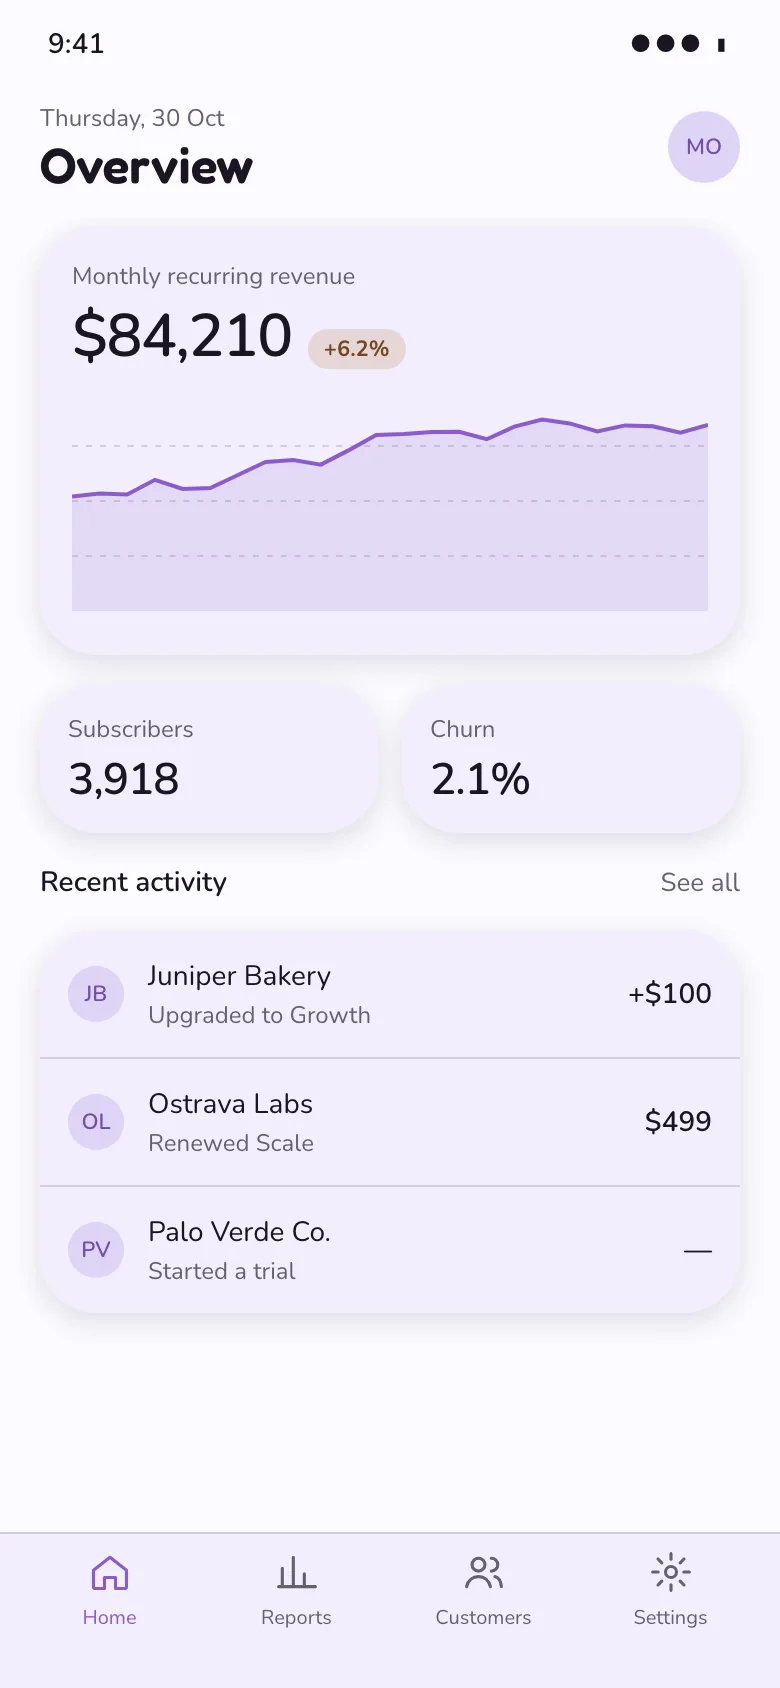
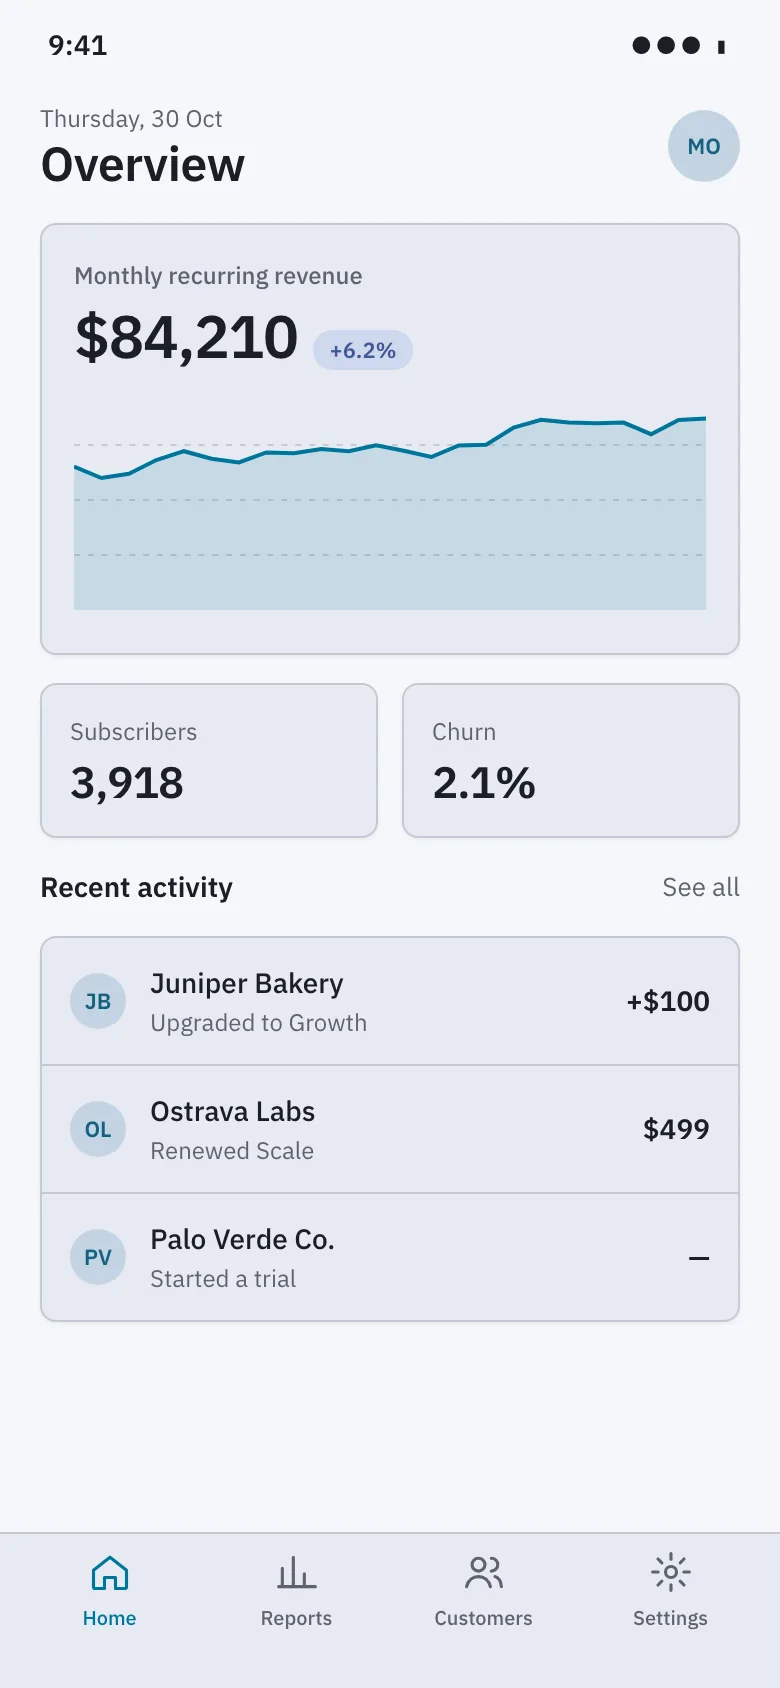
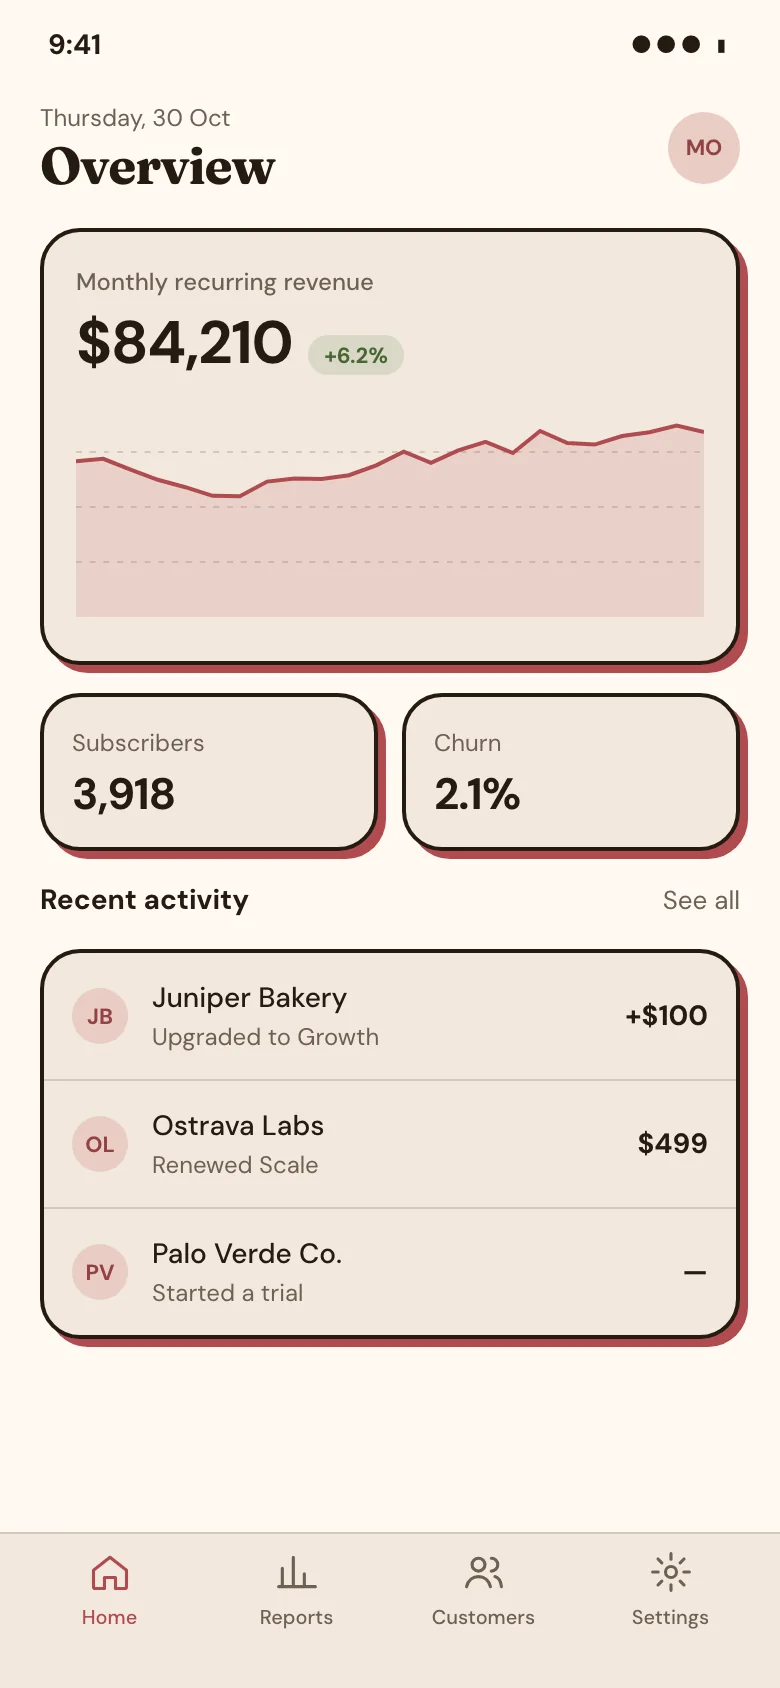
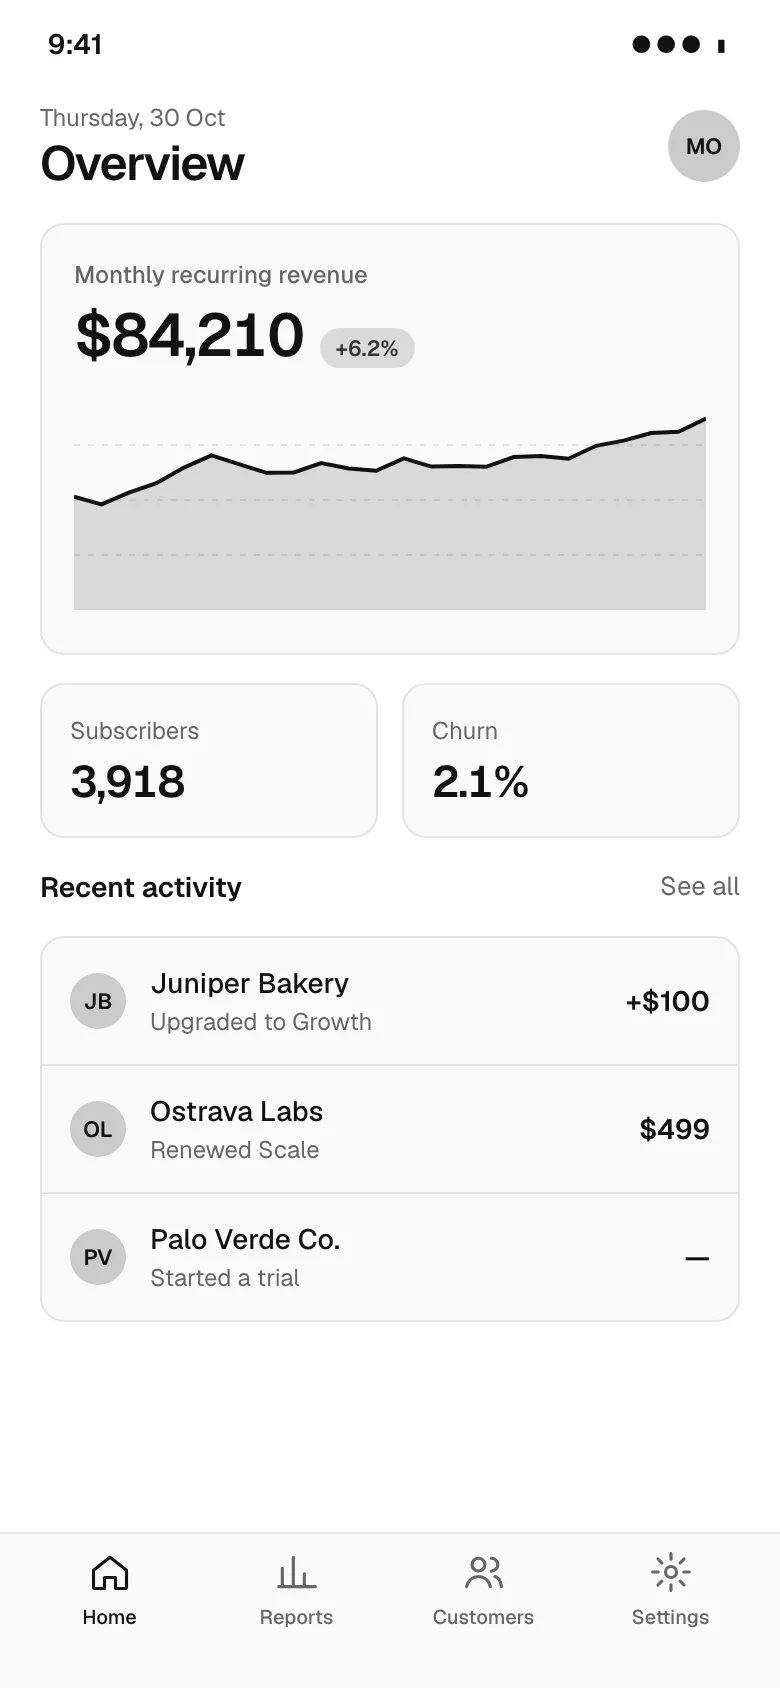
See it in a flow
Look up a customer and report on them
Dashboard design tips
- Show each KPI with its change against a stated comparison period, because a number without context tells people nothing about whether it is good.
- Put the most important metric in the top-left position on desktop and first on mobile, since that is where scanning usually begins.
- Use one accent colour for the primary series and muted greys for comparisons, so the eye goes to the data that matters.
- Link every card and chart through to a detailed view, so the dashboard acts as a starting point rather than a dead end.
Questions
What should a dashboard show?
Only the few metrics that tell people whether things are on track and what needs attention, typically four to six headline KPIs, one or two trend charts and a short list of recent items. Everything else belongs in detailed reports. A dashboard should be readable in under a minute.
How do you lay out a dashboard?
Put headline numbers in a row of cards at the top, trend charts in the middle and detail such as tables below. Align everything to a grid, keep card heights consistent and group related metrics. On mobile, stack sections in the same order of importance.
Should dashboards use dark mode?
Offer it rather than force it. Dark themes suit people who monitor screens for long periods or in dim rooms, but chart colours need adjusting so they keep contrast without glaring. Design both themes from the same tokens so the hierarchy stays identical.
Browse by pattern
App screens
Data table
Analytics charts
Login
Sign up
Forgot password
Two-factor code
Welcome
Onboarding step
Permissions request
Home
Feed
List view
Detail view
Kanban board
Calendar
File manager
Search results
Editor toolbar
AI chat assistant
Chat list
Chat thread
Video call
Image viewer
Map view
Video player
Create post
Class schedule
Booking details
Booking confirmed
Product detail
Cart
Checkout
Order confirmation
Settings
Profile
Notifications center
Team members
Roles permissions
Audit log
API keys
Integrations
Billing plans
Invoice
Paywall upgrade
Cancel subscription
Empty state
404 error
Loading skeleton
Success confirmation
AI workspace
AI settings
Version history
Approval queue
Doctor directory
Telehealth visit
Clinic home
Music player
Playlist
Portfolio home
Case study
Security dashboard
Project tracker
Course dashboard
Multi-step form wizard
Bank onboarding
Product scan
Split view (master-detail)
Canvas editor
Floor plan
Voice call
Toast / snackbar with undo
Confirm dialog (destructive)
Side drawer
Command palette
Date range picker
Form validation errors
Sign-in error
Card declined at checkout
Find a pro (home services)
Book a home-service visit
Job tracker
Account email
Order email
Shift scheduler
Leave calendar
Time-off request
Multi-location operations dashboard
Inventory stock
Savings goal
Onboarding carousel
UI components
Cards
Pagination
Popover
Tooltip
Dropdown menu
Accordion
Radio buttons
Breadcrumbs
Toggle switch
Stepper
Sidebar navigation
Loading spinner
Website sections
Navigation header
Feature grid
Bento features
How it works
Logo cloud
Stats band
Testimonials
Pricing
Comparison table
Scored comparison table
Integrations grid
Security and trust
FAQ
CTA banner
About team
Careers
Blog index
Changelog
Contact form
Footer
Website templates
Agency website templates
Architecture website templates
Wedding website templates
Ecommerce website templates
Cafe and coffee shop website templates
Salon website templates
Real estate agency website templates
Construction website templates
Law firm website templates
Dental website templates
Gym website templates
School and education website templates
Nonprofit website templates
Travel website templates
Hotel website templates
SaaS landing page templates
AI website templates
Medical website templates
Cardiology website templates
Dermatology website templates
Therapist website templates
Physical therapy website templates
Veterinary website templates
Financial advisor website templates
Cleaning service website templates
HVAC website templates
Cybersecurity website templates
CRM landing page templates
Coaching website templates
Pest control website templates
Solar website templates
AI agent website templates
Preschool website templates
Apartment community website templates
Pediatric website templates
Orthodontics website templates
Fertility clinic website templates
Hospital website templates
Mental health clinic website templates
Optometry website templates
Pharmacy website templates
Real estate agent website templates
Property management website templates
Luxury real estate website templates
Commercial real estate website templates
Vacation rental website templates
Home builder website templates
Bakery website templates
Pizzeria website templates
Bar and pub website templates
Catering website templates
Food truck website templates
Fine dining website templates
search_ui_screens (e.g. “billing settings, editorial style”), get_ui_flow for a whole journey, and get_ui_screen_code to pull the HTML and DESIGN.md straight into your project.