Stats section design examples
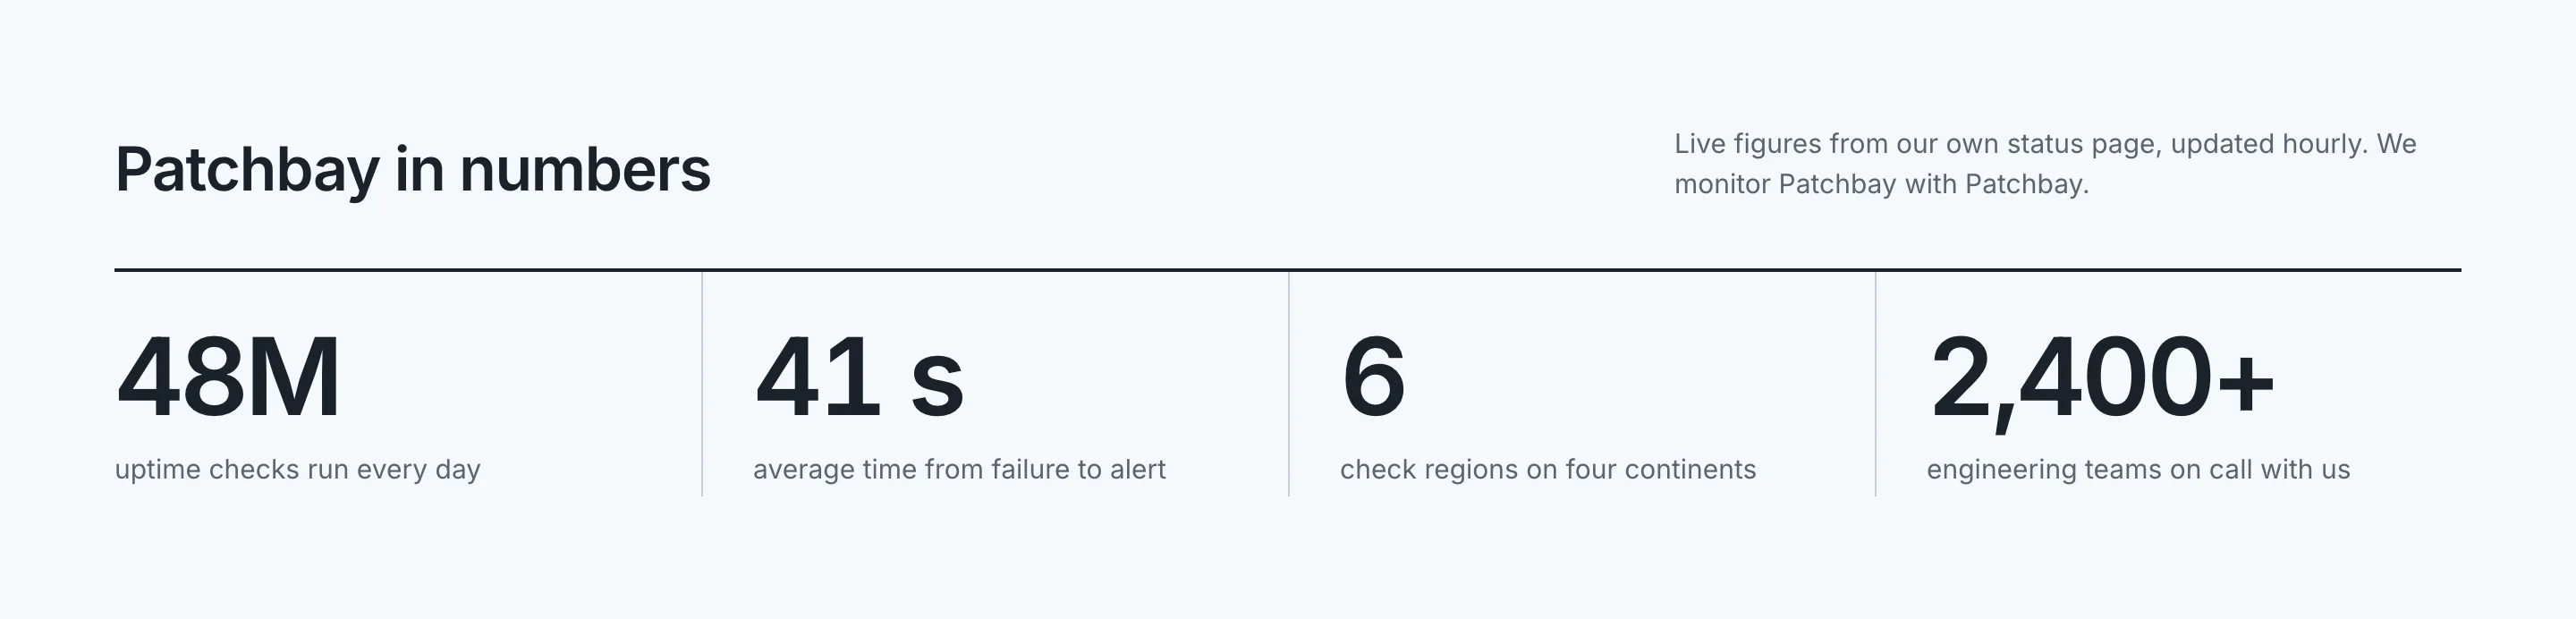
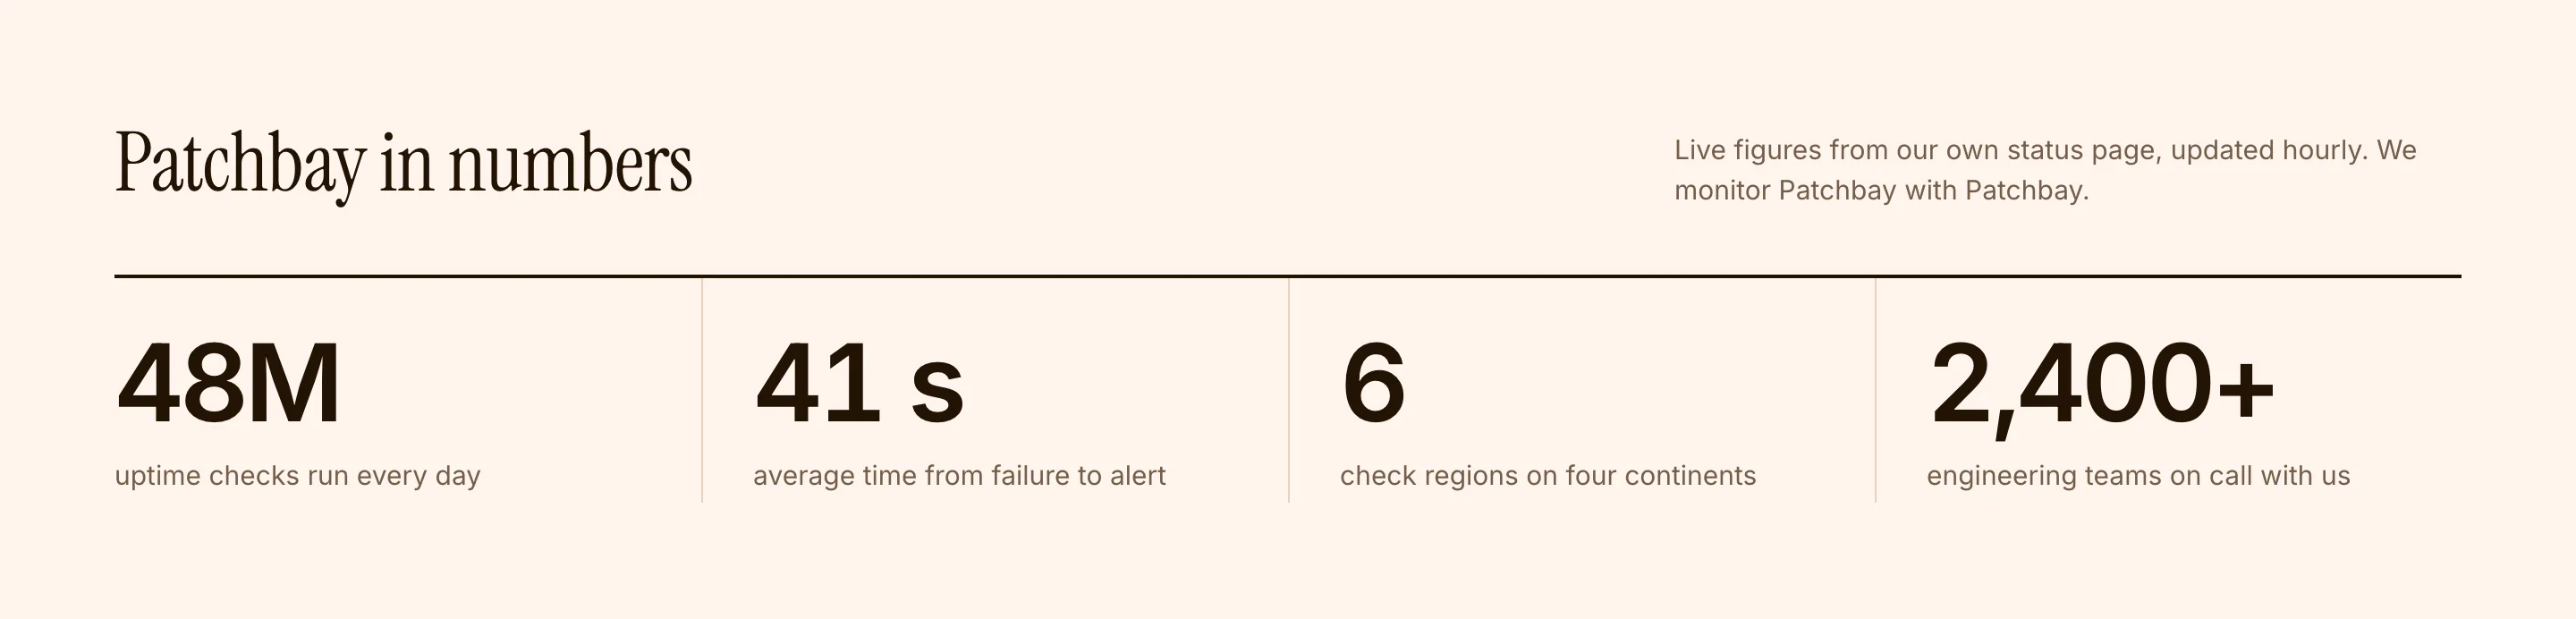
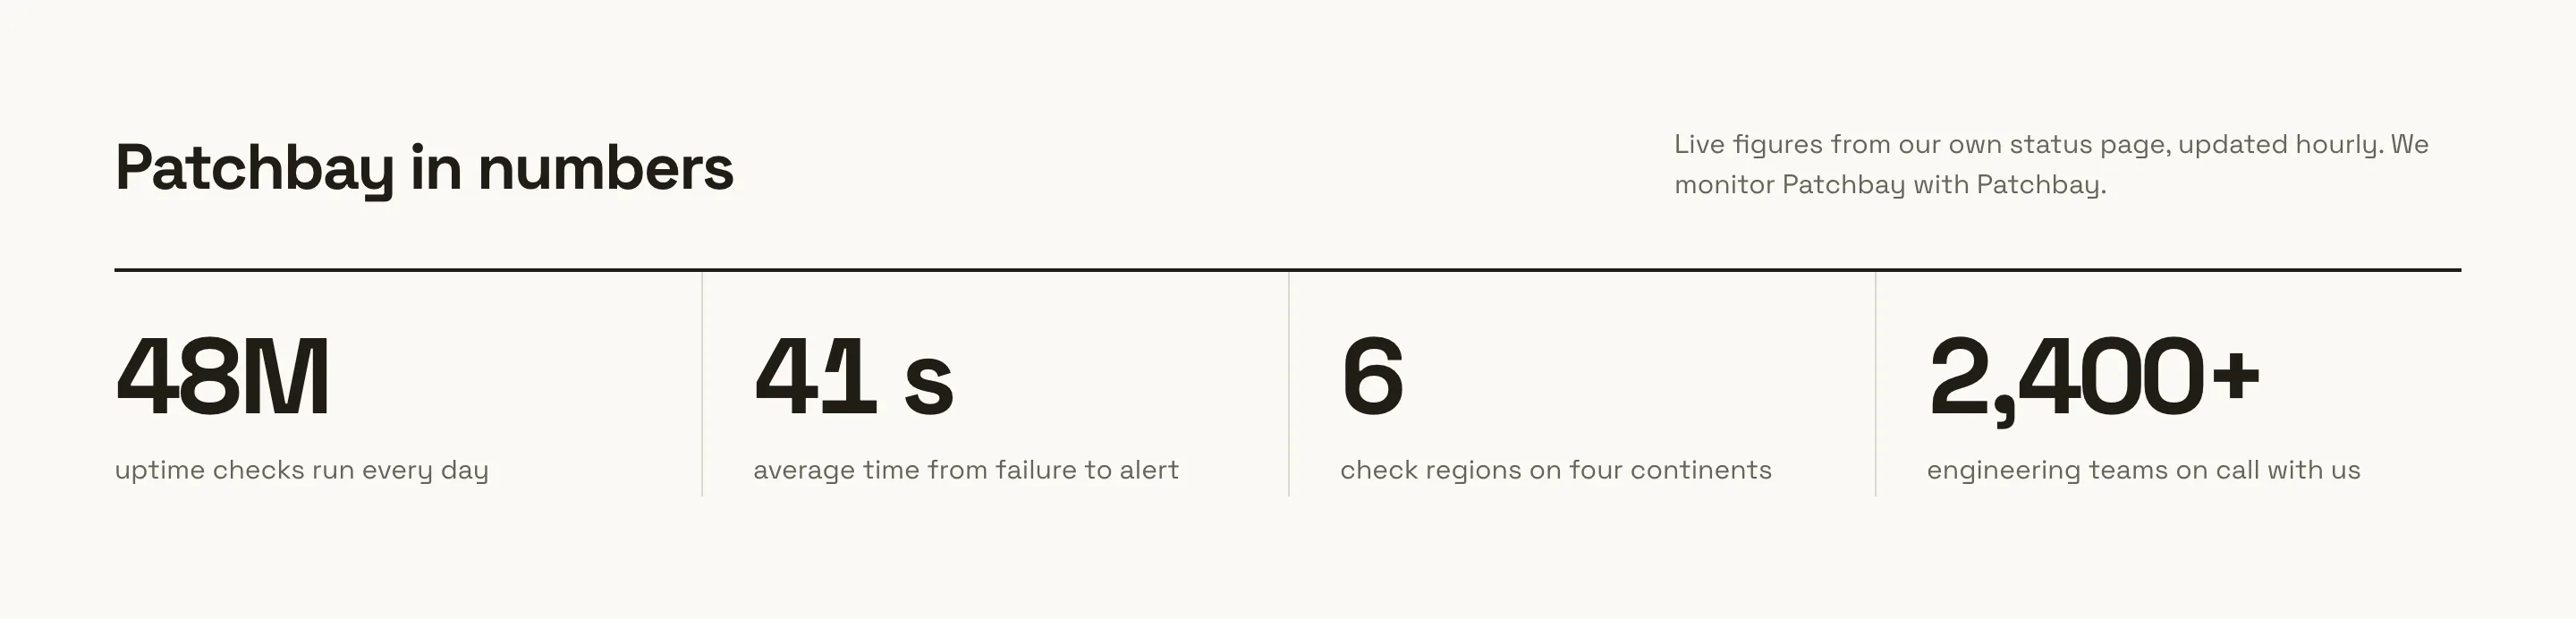
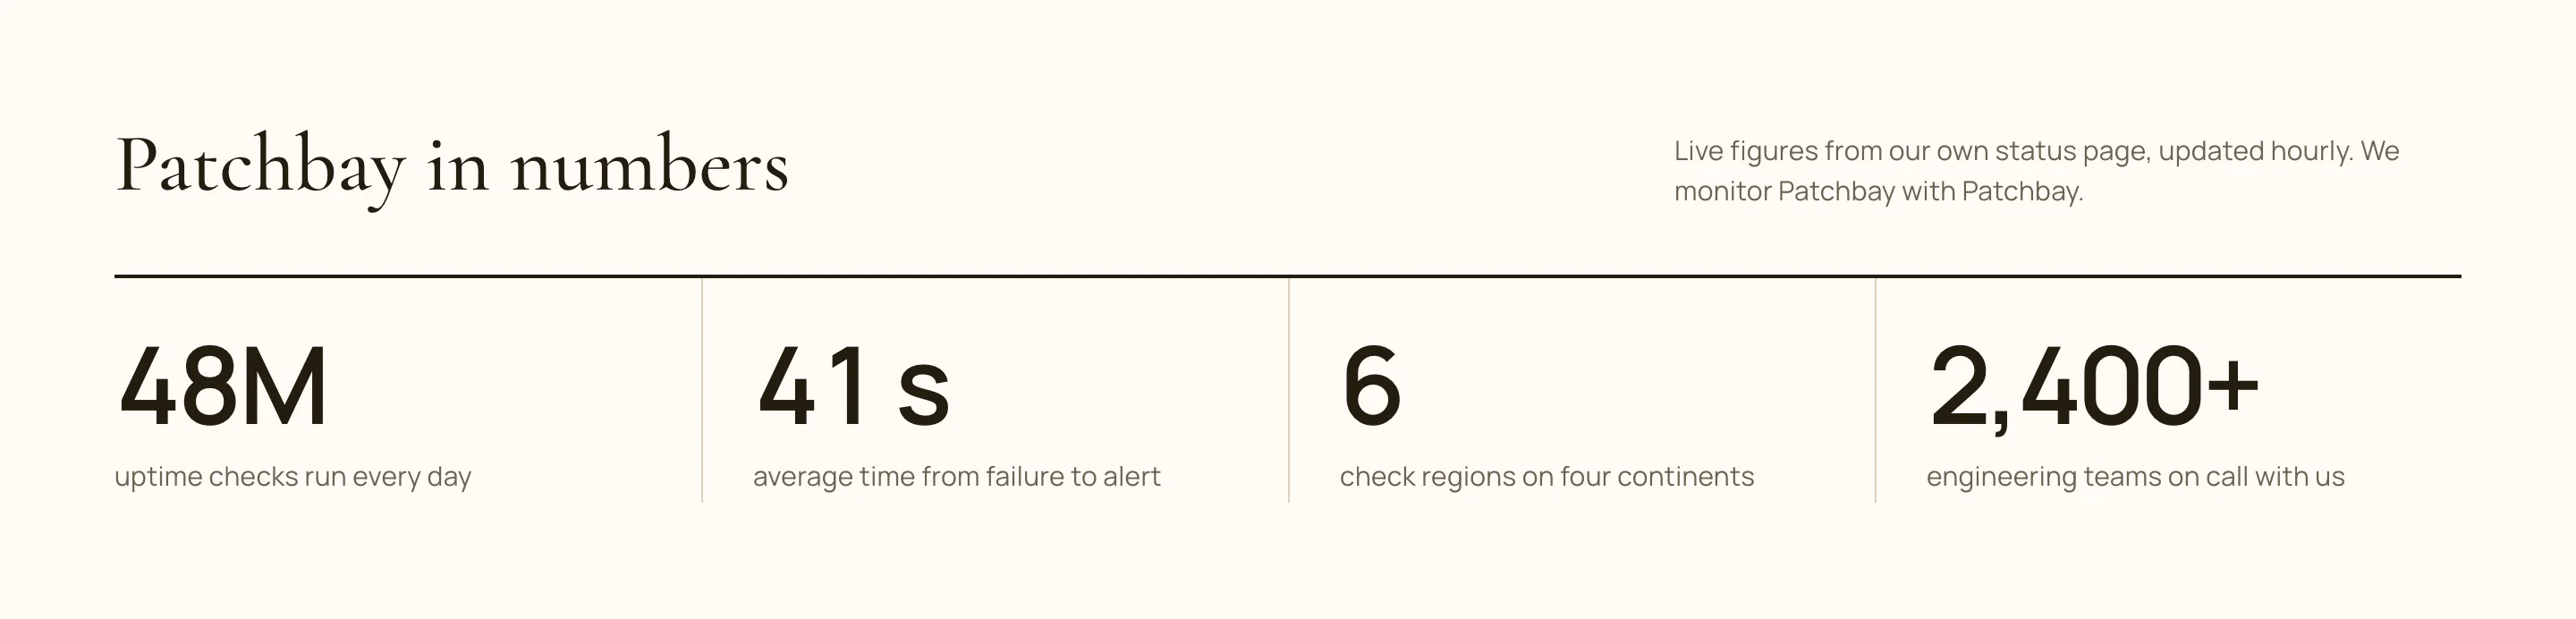
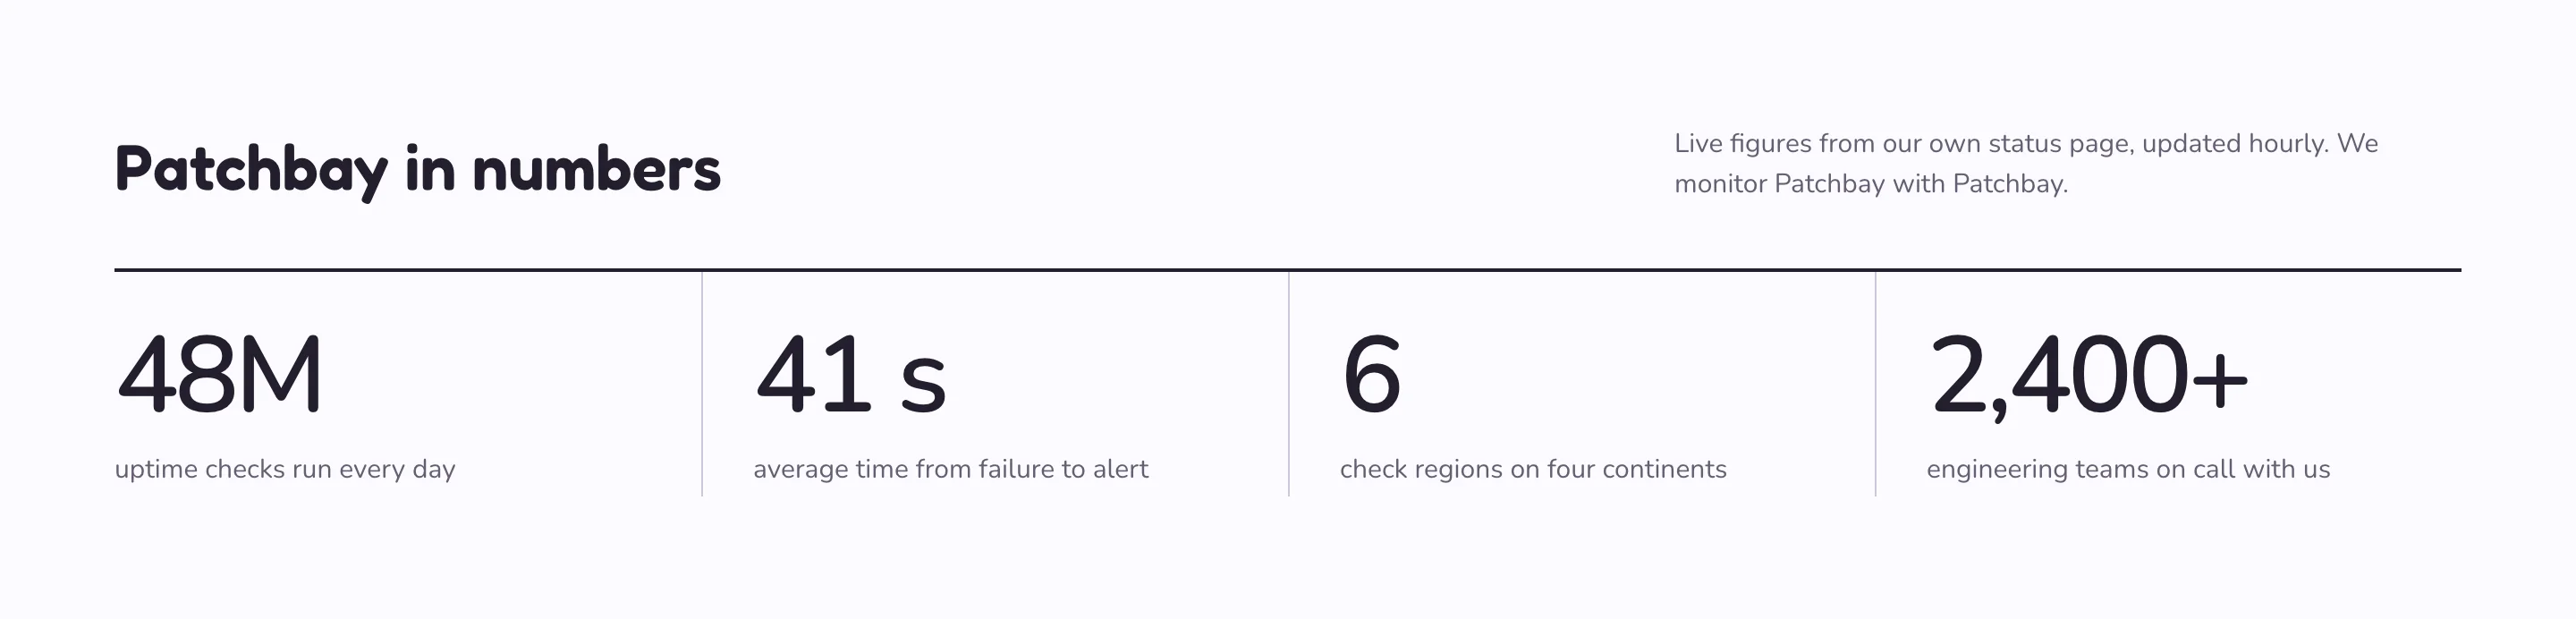
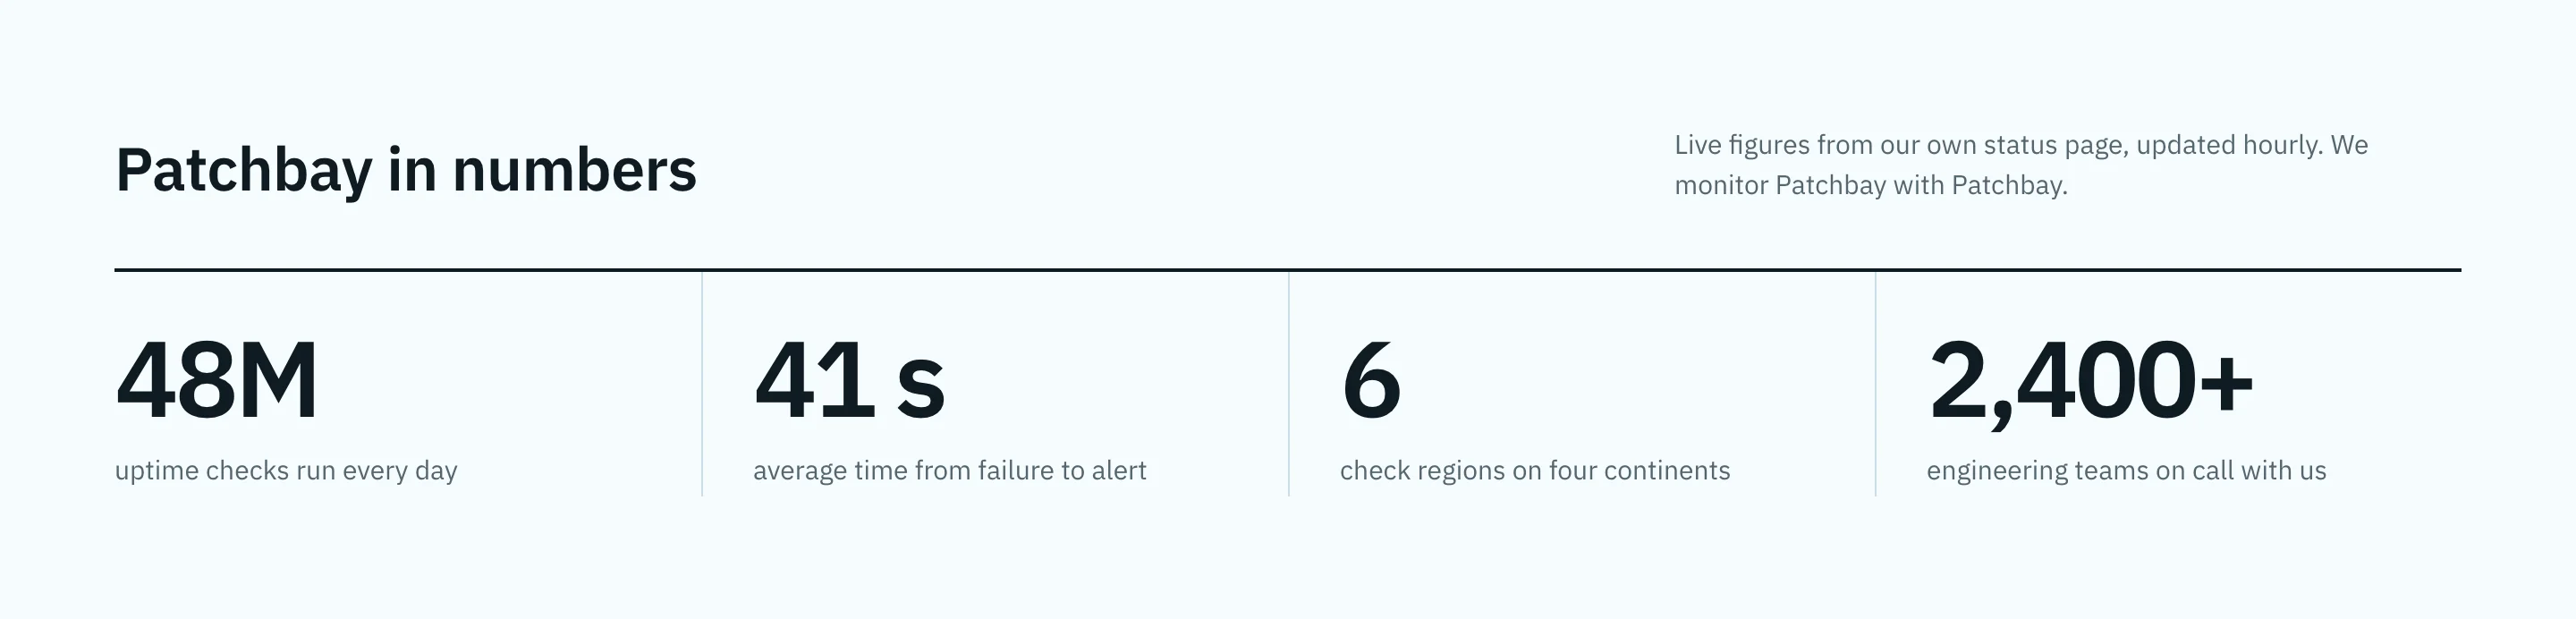
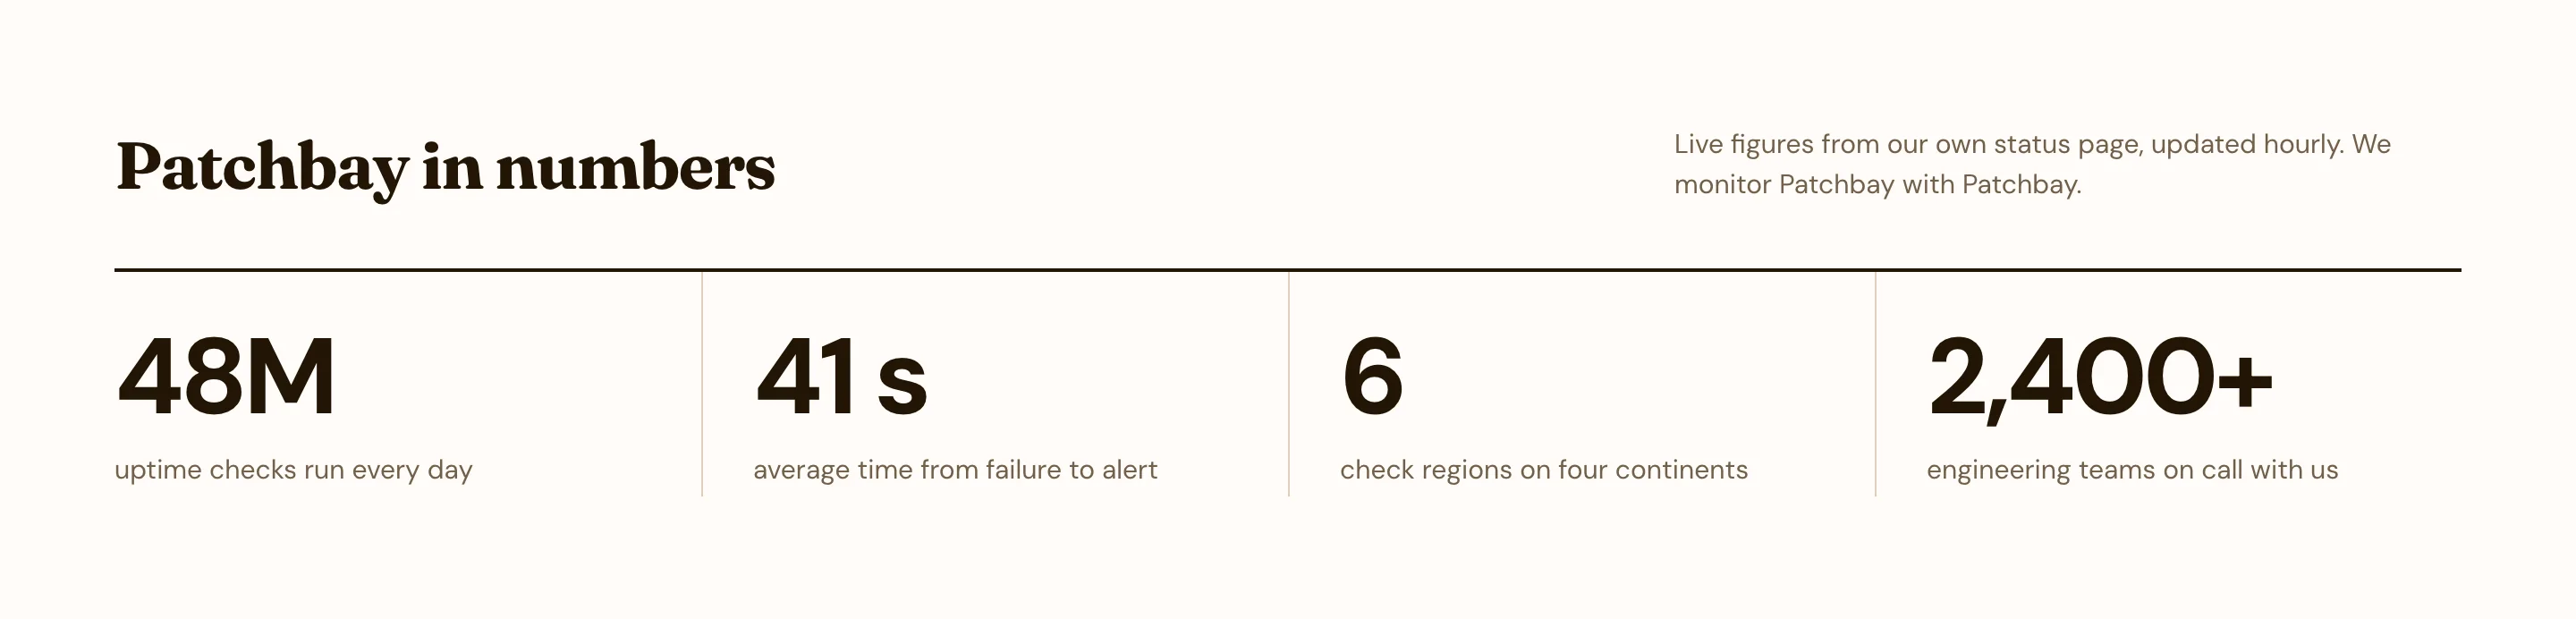
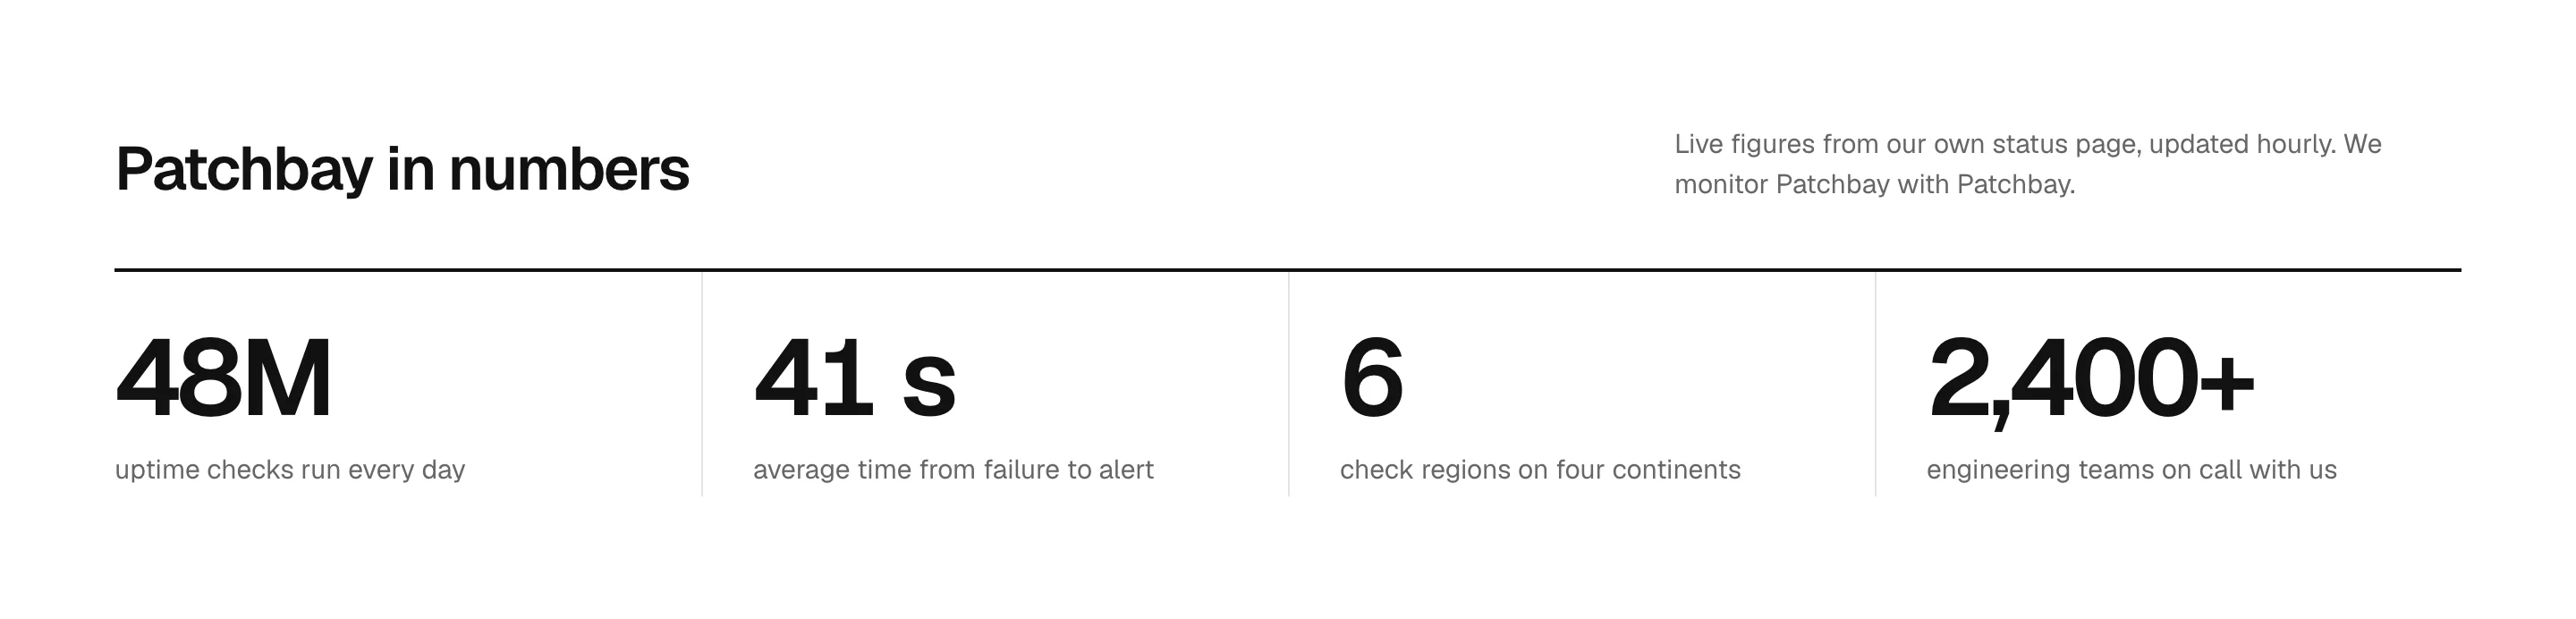
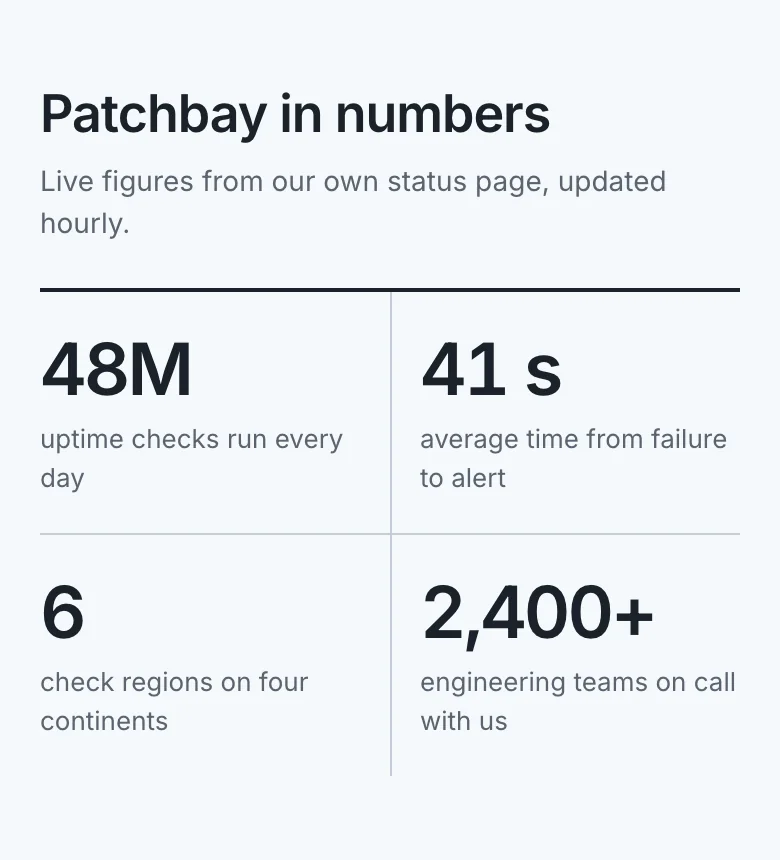
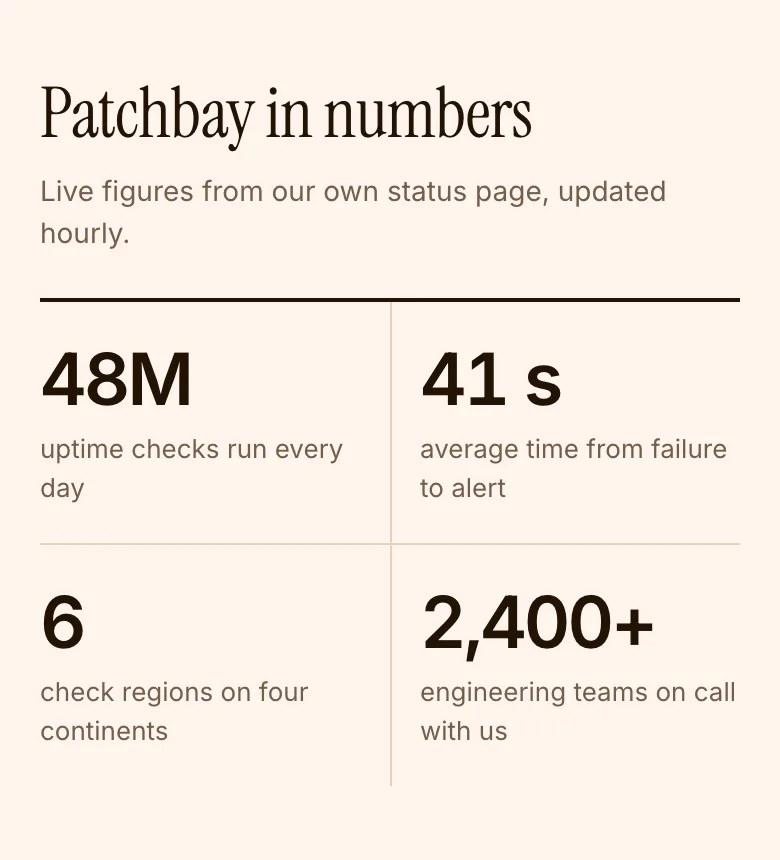
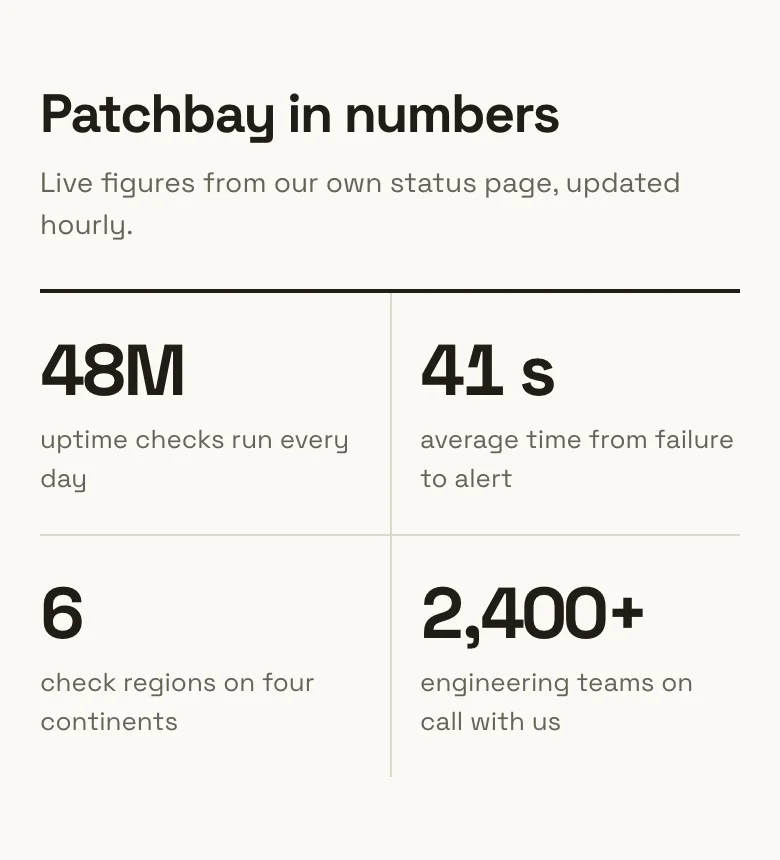
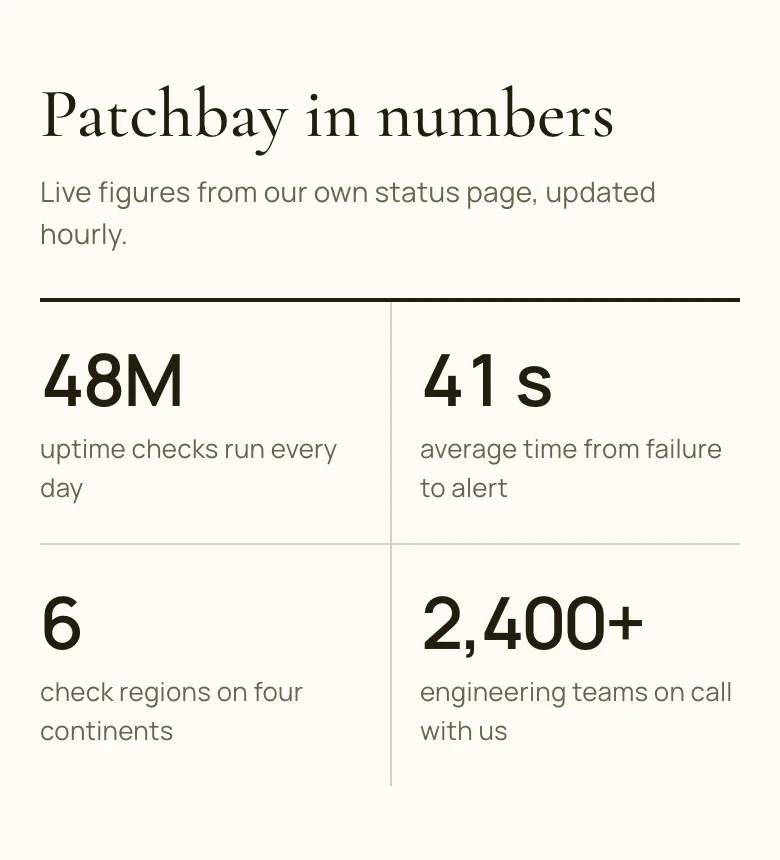
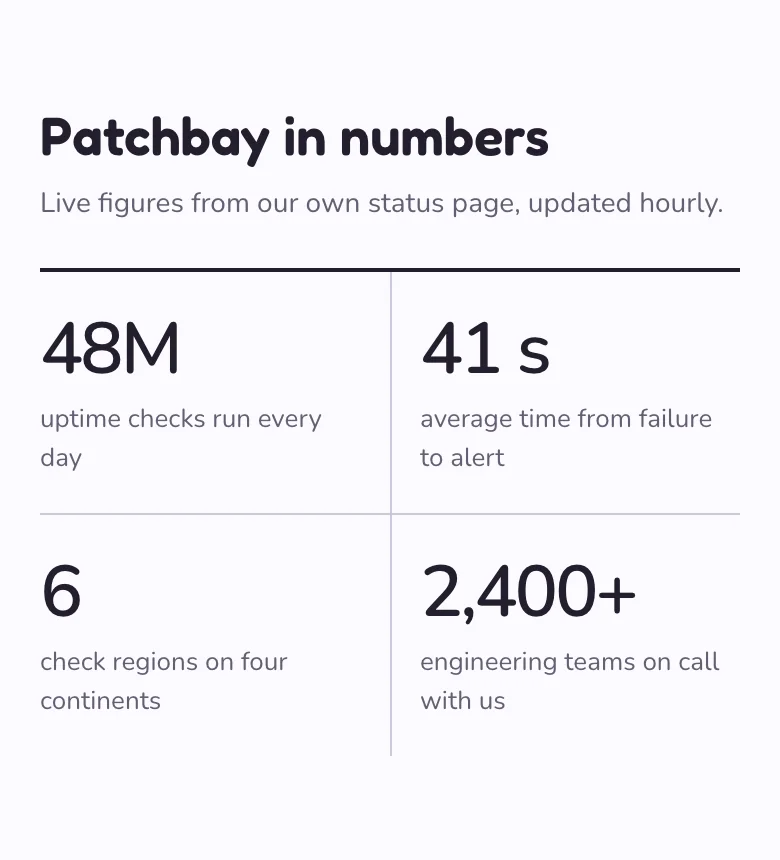
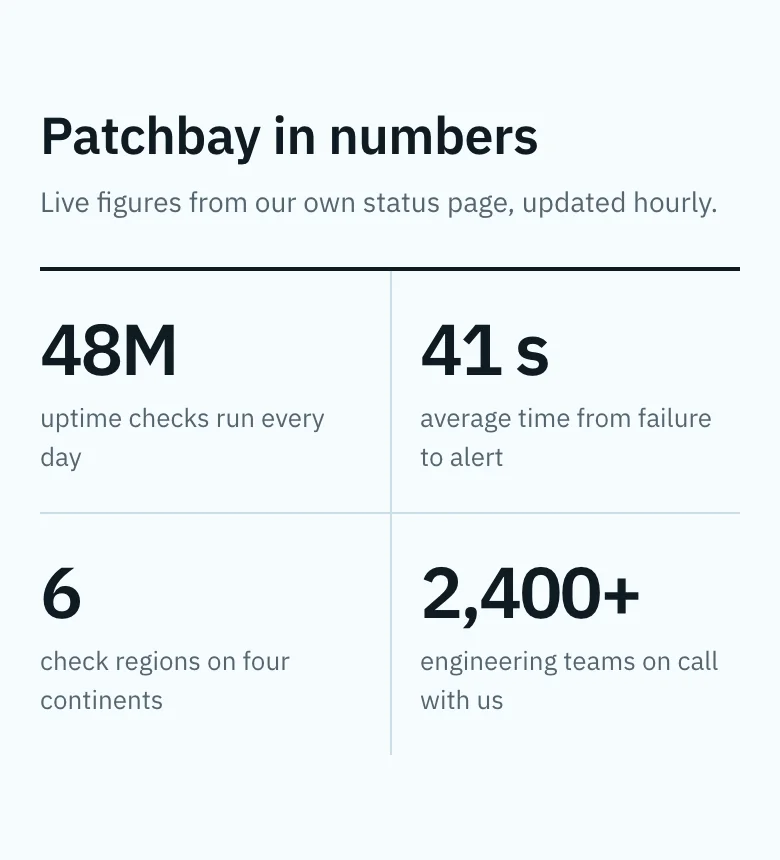
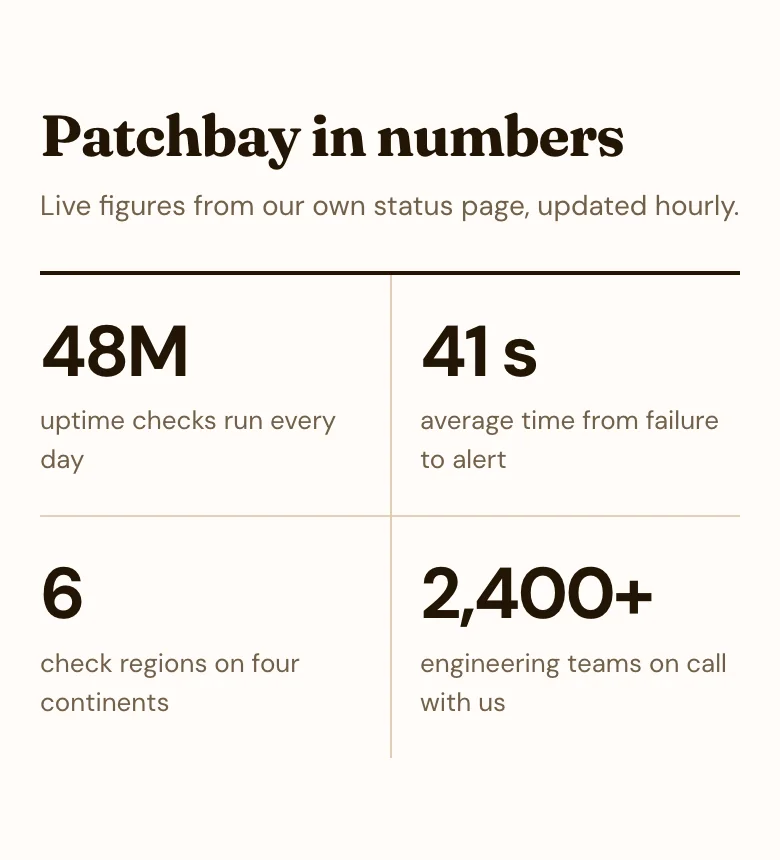
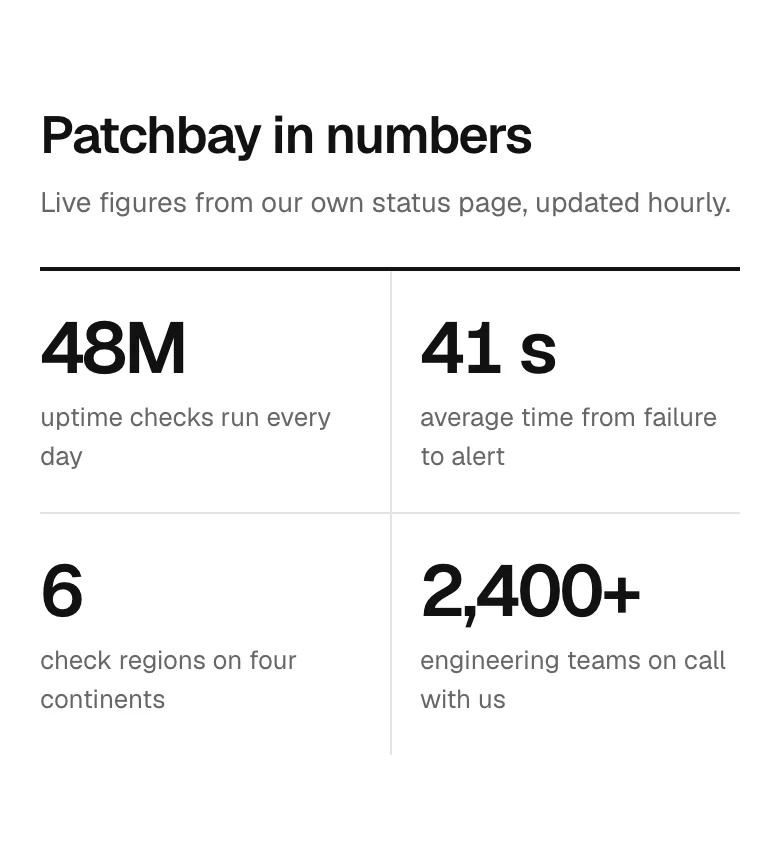
A stats band backs up a landing page's claims with a few large, memorable figures. Our examples show a heading with a short supporting line and four large figures with labels covering checks run, alert time, regions and teams, laid out for web and mobile in eight visual styles with light and dark versions. Every example is an original design that comes with its HTML code and a DESIGN.md of colour, type and spacing tokens, in light and dark. Free to use and adapt.
16 examples
Stats band design tips
- Pick three or four figures that support the page's main promise, rather than every number you can find.
- Give each figure a short label that says exactly what is counted, so the number cannot be misread or overstated.
- Round large numbers sensibly and use consistent units and suffixes so the row reads as a set.
- Use only figures you can stand behind, and note the time period or source in small text where it matters.
Questions
What numbers work best in a stats section?
Figures that prove the main benefit of the product work best, such as speed, scale, reliability or customer count. A number only persuades if the reader understands what it measures, so pair each one with a clear label and keep the set focused.
Should stats count up with an animation?
A brief count-up can draw the eye, but it is optional. Keep it short, run it once when the band scrolls into view and respect reduced-motion preferences. The final figures must be present in the HTML so search engines and screen readers get the real numbers.
How many stats should a stats band contain?
Three or four is a comfortable number for one row on desktop, and it reflows neatly into a two-by-two grid on mobile. More than that dilutes attention, and readers tend to remember only one or two of the figures anyway.
Browse by pattern
App screens
Data table
Analytics charts
Login
Sign up
Forgot password
Two-factor code
Welcome
Onboarding step
Permissions request
Home
Feed
List view
Detail view
Kanban board
Calendar
File manager
Search results
Editor toolbar
AI chat assistant
Chat list
Chat thread
Video call
Image viewer
Map view
Video player
Create post
Class schedule
Booking details
Booking confirmed
Product detail
Cart
Checkout
Order confirmation
Settings
Profile
Notifications center
Team members
Roles permissions
Audit log
API keys
Integrations
Billing plans
Invoice
Paywall upgrade
Cancel subscription
Empty state
404 error
Loading skeleton
Success confirmation
AI workspace
AI settings
Version history
Approval queue
Doctor directory
Telehealth visit
Clinic home
Music player
Playlist
Portfolio home
Case study
Security dashboard
Project tracker
Course dashboard
Multi-step form wizard
Bank onboarding
Product scan
Split view (master-detail)
Canvas editor
Floor plan
Voice call
Toast / snackbar with undo
Confirm dialog (destructive)
Side drawer
Command palette
Date range picker
Form validation errors
Sign-in error
Card declined at checkout
Find a pro (home services)
Book a home-service visit
Job tracker
Account email
Order email
Shift scheduler
Leave calendar
Time-off request
Multi-location operations dashboard
Inventory stock
Savings goal
Onboarding carousel
UI components
Cards
Pagination
Popover
Tooltip
Dropdown menu
Accordion
Radio buttons
Breadcrumbs
Toggle switch
Stepper
Sidebar navigation
Loading spinner
Website sections
Navigation header
Feature grid
Bento features
How it works
Logo cloud
Stats band
Testimonials
Pricing
Comparison table
Scored comparison table
Integrations grid
Security and trust
FAQ
CTA banner
About team
Careers
Blog index
Changelog
Contact form
Footer
Website templates
Agency website templates
Architecture website templates
Wedding website templates
Ecommerce website templates
Cafe and coffee shop website templates
Salon website templates
Real estate agency website templates
Construction website templates
Law firm website templates
Dental website templates
Gym website templates
School and education website templates
Nonprofit website templates
Travel website templates
Hotel website templates
SaaS landing page templates
AI website templates
Medical website templates
Cardiology website templates
Dermatology website templates
Therapist website templates
Physical therapy website templates
Veterinary website templates
Financial advisor website templates
Cleaning service website templates
HVAC website templates
Cybersecurity website templates
CRM landing page templates
Coaching website templates
Pest control website templates
Solar website templates
AI agent website templates
Preschool website templates
Apartment community website templates
Pediatric website templates
Orthodontics website templates
Fertility clinic website templates
Hospital website templates
Mental health clinic website templates
Optometry website templates
Pharmacy website templates
Real estate agent website templates
Property management website templates
Luxury real estate website templates
Commercial real estate website templates
Vacation rental website templates
Home builder website templates
Bakery website templates
Pizzeria website templates
Bar and pub website templates
Catering website templates
Food truck website templates
Fine dining website templates
search_ui_screens (e.g. “billing settings, editorial style”), get_ui_flow for a whole journey, and get_ui_screen_code to pull the HTML and DESIGN.md straight into your project.